cancel
Showing results for 
Search instead for 
Did you mean: 

Level up your Power BI skills this month - build one visual each week and tell better stories with data! Get started

Reply
saavedrag12
Frequent Visitor

How to create a summary measure across multiple columns?

Hello, 


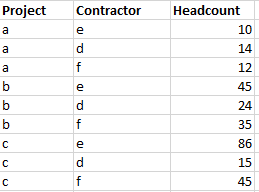
I'm trying to create a dynamic measure that will provide with a total headcount across mutilple fields (columns). Please see image below for example: 

saavedrag12_0-1655412824036.png

I would like a measure that would identify the total headcount for a given contractor or project. I've started with this measure :

Measure_AS_Peak_HC = SUMX(SUMMARIZE(Table_Headcount,[Contractor],[Project],"Max HC", MAX(Table_Headcount[Headcount]),[Max HC])
 
However, it's returning the MAX HC of a contractor for a single project rather than giving me a max hc for a contractor across all projects, if that makes sense?
6 REPLIES 6
v-zhangti
Community Support
Community Support

Hi, @saavedrag12 


Please check the following methods.

Measure = 
CALCULATE (
    MAX ( Table_Headcount[Headcount] ),
    FILTER (
        ALL ( Table_Headcount ),
        [Contractor] = SELECTEDVALUE ( Table_Headcount[Contractor] )
    )
)

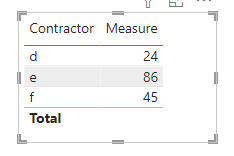
vzhangti_0-1655780119494.png

Is this the output you expect? If not, please tell the result you expect, showing it in pictures.


Best Regards,

Community Support Team _Charlotte

If this post helps, then please consider Accept it as the solution to help the other members find it more quickly.

Hello, 
The Calculate function does not allow me to utilize the filter function for the second argument. 

Hi, @saavedrag12 


Is it possible to show a picture of the problem you encountered and the results you expect?


Best Regards

vapid128
Solution Specialist
Solution Specialist

Could you just show your result in excel?

vapid128
Solution Specialist
Solution Specialist

Can you just tell what number you tring to get?

max headcount of contractor of e? 141?

I'm trying to get the total headcount that will then be adjusted when filters are applied to project and contractor. 

Helpful resources

Announcements
April Power BI Update Carousel

Power BI Monthly Update - April 2026

Check out the April 2026 Power BI update to learn about new features.

Fabric SQL PBI Data Days

Data Days 2026 coming soon!

Sign up to receive a private message when registration opens and key events begin.

New to Fabric survey Carousel

New to Fabric Survey

If you have recently started exploring Fabric, we'd love to hear how it's going. Your feedback can help with product improvements.

Power BI DataViz World Championships carousel

Power BI DataViz World Championships - June 2026

A new Power BI DataViz World Championship is coming this June! Don't miss out on submitting your entry.