Party with Power BI’s own Guy in a Cube
Power BI is turning 10! Tune in for a special live episode on July 24 with behind-the-scenes stories, product evolution highlights, and a sneak peek at what’s in store for the future.
Save the date- Power BI forums
- Get Help with Power BI
- Desktop
- Service
- Report Server
- Power Query
- Mobile Apps
- Developer
- DAX Commands and Tips
- Custom Visuals Development Discussion
- Health and Life Sciences
- Power BI Spanish forums
- Translated Spanish Desktop
- Training and Consulting
- Instructor Led Training
- Dashboard in a Day for Women, by Women
- Galleries
- Data Stories Gallery
- Themes Gallery
- Contests Gallery
- Quick Measures Gallery
- Notebook Gallery
- Translytical Task Flow Gallery
- TMDL Gallery
- R Script Showcase
- Webinars and Video Gallery
- Ideas
- Custom Visuals Ideas (read-only)
- Issues
- Issues
- Events
- Upcoming Events
Enhance your career with this limited time 50% discount on Fabric and Power BI exams. Ends August 31st. Request your voucher.
- Power BI forums
- Forums
- Get Help with Power BI
- DAX Commands and Tips
- Re: How to calculate totals by rows?
- Subscribe to RSS Feed
- Mark Topic as New
- Mark Topic as Read
- Float this Topic for Current User
- Bookmark
- Subscribe
- Printer Friendly Page

- Mark as New
- Bookmark
- Subscribe
- Mute
- Subscribe to RSS Feed
- Permalink
- Report Inappropriate Content
How to calculate totals by rows?
It would seem a simple question, but I can’t solve it in Power BI...
You can get pbix exampe via this link (unfortunately direct loading is not available for me in this forum):
https://www.dropbox.com/s/vmt0z7n8ai3phgq/DAX%20Issue%20Example%202.pbix?dl=0
In this example I'm getting zero values for the totals of columns Effect and MixEffect:
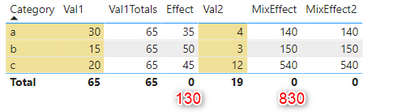
But I need get 130 (35 + 50 + 45) and 830 (140 + 150 + 540).
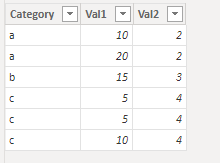
This example is based on the following simple data:
Solved! Go to Solution.


- Mark as New
- Bookmark
- Subscribe
- Mute
- Subscribe to RSS Feed
- Permalink
- Report Inappropriate Content
@ikibirev you can write these two measures
_effect = SUMX(VALUES(TestTable[Category]),[Effect])

_effect = SUMX(VALUES(TestTable[Category]),[Effect])
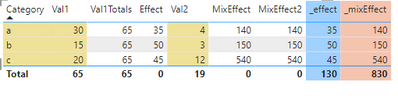
- Mark as New
- Bookmark
- Subscribe
- Mute
- Subscribe to RSS Feed
- Permalink
- Report Inappropriate Content
@ikibirev you can write these two measures
_effect = SUMX(VALUES(TestTable[Category]),[Effect])

_effect = SUMX(VALUES(TestTable[Category]),[Effect])
- Mark as New
- Bookmark
- Subscribe
- Mute
- Subscribe to RSS Feed
- Permalink
- Report Inappropriate Content
Greate! You are Superb!
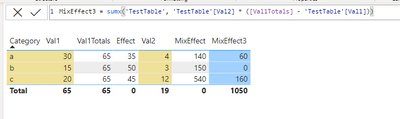
The formula in your answer was slightly not exactly copy-pated, but I got the idea. Merged this answer with ValtteriN answer.
So the result formulas are:
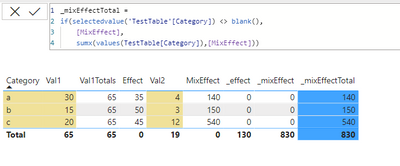
Thank you very much!

- Mark as New
- Bookmark
- Subscribe
- Mute
- Subscribe to RSS Feed
- Permalink
- Report Inappropriate Content
Hi,
The total of a matrix uses the same logic as with the measure in the column. To create a custom total which calculates all of the values you can use SUMX and IF.
Here is a very similar solution to your case:
https://community.powerbi.com/t5/DAX-Commands-and-Tips/Total-wrong/m-p/2268244#M55107
The basic dax is as follows:
I hope this post helps to solve your issue and if it does consider accepting it as a solution and giving the post a thumbs up!
Did I answer your question? Mark my post as a solution!
Proud to be a Super User!
- Mark as New
- Bookmark
- Subscribe
- Mute
- Subscribe to RSS Feed
- Permalink
- Report Inappropriate Content
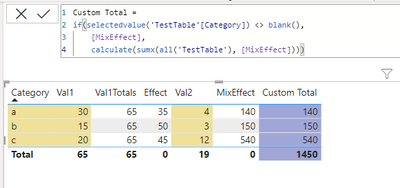
A very interesting idea! But unfortunately the result is different from zero, but has the wrong value (1450 instead 830):

- Mark as New
- Bookmark
- Subscribe
- Mute
- Subscribe to RSS Feed
- Permalink
- Report Inappropriate Content
- Mark as New
- Bookmark
- Subscribe
- Mute
- Subscribe to RSS Feed
- Permalink
- Report Inappropriate Content

Helpful resources

Fabric Community Update - July 2025
Find out what's new and trending in the Fabric community.

Power BI Monthly Update - July 2025
Check out the July 2025 Power BI update to learn about new features.

| User | Count |
|---|---|
| 25 | |
| 12 | |
| 8 | |
| 6 | |
| 6 |


| User | Count |
|---|---|
| 26 | |
| 12 | |
| 11 | |
| 8 | |
| 6 |


