Join us at FabCon Vienna from September 15-18, 2025
The ultimate Fabric, Power BI, SQL, and AI community-led learning event. Save €200 with code FABCOMM.
Get registered- Power BI forums
- Get Help with Power BI
- Desktop
- Service
- Report Server
- Power Query
- Mobile Apps
- Developer
- DAX Commands and Tips
- Custom Visuals Development Discussion
- Health and Life Sciences
- Power BI Spanish forums
- Translated Spanish Desktop
- Training and Consulting
- Instructor Led Training
- Dashboard in a Day for Women, by Women
- Galleries
- Data Stories Gallery
- Themes Gallery
- Contests Gallery
- Quick Measures Gallery
- Notebook Gallery
- Translytical Task Flow Gallery
- TMDL Gallery
- R Script Showcase
- Webinars and Video Gallery
- Ideas
- Custom Visuals Ideas (read-only)
- Issues
- Issues
- Events
- Upcoming Events
Enhance your career with this limited time 50% discount on Fabric and Power BI exams. Ends September 15. Request your voucher.
- Power BI forums
- Forums
- Get Help with Power BI
- DAX Commands and Tips
- How to calculate the percentage on a column week o...
- Subscribe to RSS Feed
- Mark Topic as New
- Mark Topic as Read
- Float this Topic for Current User
- Bookmark
- Subscribe
- Printer Friendly Page
- Mark as New
- Bookmark
- Subscribe
- Mute
- Subscribe to RSS Feed
- Permalink
- Report Inappropriate Content
How to calculate the percentage on a column week over week
Hi everyone,
I'm having some issues with calculating percentages on a column, line by line. I will show the examlple I have in Excel of what I want to my PBI to look like, and hopefully you guys can help me with a better DAX expression than the one I developed as an attempt to solve my problem.
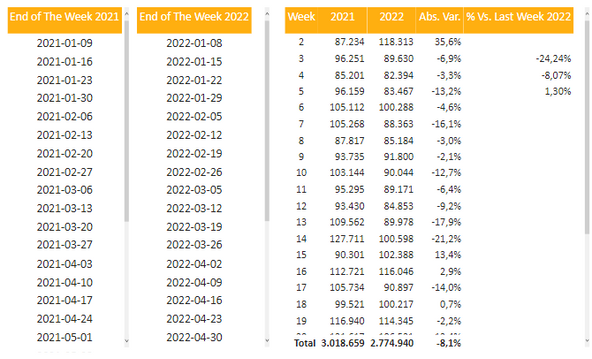
So, in my excel, I'm having data from units that I'm selling, week over week, for years 2021 and 2022. In PBI I was able to develop some matrices, with the exception of the column G; column G basically takes week 3 (2022) and subtract from week 2 (2022) and return the percentage of that subtraction.
Here's how my PBI looks like and my attempt to solve this problem with my DAX expression:
So the column I'm trynig to develop here is the "% Vs. Last Week 2022". I actually found out an expression that works! However, this expression is huge and I'm concerned that it can compromise the performance of my dashboard overall; and also takes too much time to write it down... So here's the expression:
The expression works! But as I said, the problem is that I have to include about 53 (number of weeks over the year) "IF" expressions as the percentage calculate for one value of the column "Visao_Semanal[Semana]"...
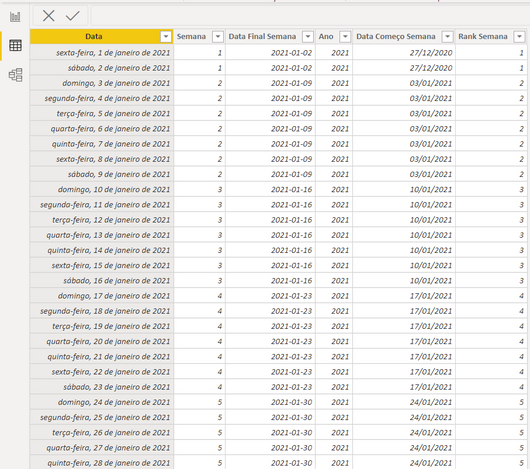
Here's the table I'm using for those matrices, named "Visao_Semanal"
To a better understanding of the columns names (they're in portuguese, sorry):
1 - Data = Date
2 - Semana = Week
3 - Data Final Semana = Last day of the week
4 - Ano = Year
5 - Data Começo Semana = First day of the week
6 - Rank Semana = Week Rank
Thank you so much guys, I'm looking forward to a better solution than the one I made!
Greetings from Brazil! 😉
Solved! Go to Solution.
- Mark as New
- Bookmark
- Subscribe
- Mute
- Subscribe to RSS Feed
- Permalink
- Report Inappropriate Content
Hi @Anonymous ,
Please try this code to replace your expression:
% Vs. Last week 2022 =
VAR _last =
    CALCULATE (
        SUM ( 'Fact table'[Sales] ),
        FILTER (
            ALLSELECTED ( 'Visao_Semanal' ),
            [Year] = 2022
                && [Week Num]
                    = MAX ( 'Visao_Semanal'[Week Num] ) - 1
        )
    )
VAR _this =
    CALCULATE (
        SUM ( 'Fact table'[Sales] ),
        FILTER (
            ALLSELECTED ( 'Visao_Semanal' ),
            [Year] = 2022
                && [Week Num] = MAX ( 'Visao_Semanal'[Week Num] )
        )
    )
RETURN
    DIVIDE ( _this, _last ) - 1
Result:
Pbix in the end you can refer.
Best Regards
Community Support Team _ chenwu zhu
If this post helps, then please consider Accept it as the solution to help the other members find it more quickly.
- Mark as New
- Bookmark
- Subscribe
- Mute
- Subscribe to RSS Feed
- Permalink
- Report Inappropriate Content
@v-chenwuz-msft , thank you so much for this expression! It worked, exactly as I needed! Thanks a lot! 😉
- Mark as New
- Bookmark
- Subscribe
- Mute
- Subscribe to RSS Feed
- Permalink
- Report Inappropriate Content
@Anonymous , In your date table a week rank column
Week Rank = RANKX(all('Date'),'Date'[Week Start date],,ASC,Dense)
OR
Week Rank = RANKX(all('Date'),'Date'[Year Week],,ASC,Dense) //YYYYWW format
then you can have measures like
This Week = CALCULATE(sum('Table'[Qty]), FILTER(ALL('Date'),'Date'[Week Rank]=max('Date'[Week Rank])))
Last Week = CALCULATE(sum('Table'[Qty]), FILTER(ALL('Date'),'Date'[Week Rank]=max('Date'[Week Rank])-1))
WTD = CALCULATE(sum('Table'[Qty]), FILTER(ALL('Date'),'Date'[Week Rank]=max('Date'[Week Rank]) && 'Date'[WeekDay]<=max('Date'[WeekDay])-1))
LWTD = CALCULATE(sum('Table'[Qty]), FILTER(ALL('Date'),'Date'[Week Rank]=max('Date'[Week Rank])-1 && 'Date'[WeekDay]<=max('Date'[WeekDay])-1 ))
Power BI — Week on Week and WTD
https://medium.com/@amitchandak.1978/power-bi-wtd-questions-time-intelligence-4-5-98c30fab69d3
https://community.powerbi.com/t5/Community-Blog/Week-Is-Not-So-Weak-WTD-Last-WTD-and-This-Week-vs-Last-Week/ba-p/1051123
https://www.youtube.com/watch?v=pnAesWxYgJ8
- Mark as New
- Bookmark
- Subscribe
- Mute
- Subscribe to RSS Feed
- Permalink
- Report Inappropriate Content
@amitchandak , thank you so much for the support... It didn't worked well actually, however I appreciate a lot your help! Also your article you sent here was awsome to learn more about Week on Week and WTD.
Thanks!
Helpful resources
| User | Count |
|---|---|
| 15 | |
| 13 | |
| 8 | |
| 6 | |
| 6 |
| User | Count |
|---|---|
| 24 | |
| 19 | |
| 12 | |
| 9 | |
| 7 |


