Join us at FabCon Vienna from September 15-18, 2025
The ultimate Fabric, Power BI, SQL, and AI community-led learning event. Save €200 with code FABCOMM.
Get registered- Power BI forums
- Get Help with Power BI
- Desktop
- Service
- Report Server
- Power Query
- Mobile Apps
- Developer
- DAX Commands and Tips
- Custom Visuals Development Discussion
- Health and Life Sciences
- Power BI Spanish forums
- Translated Spanish Desktop
- Training and Consulting
- Instructor Led Training
- Dashboard in a Day for Women, by Women
- Galleries
- Data Stories Gallery
- Themes Gallery
- Contests Gallery
- Quick Measures Gallery
- Notebook Gallery
- Translytical Task Flow Gallery
- TMDL Gallery
- R Script Showcase
- Webinars and Video Gallery
- Ideas
- Custom Visuals Ideas (read-only)
- Issues
- Issues
- Events
- Upcoming Events
Enhance your career with this limited time 50% discount on Fabric and Power BI exams. Ends August 31st. Request your voucher.
- Power BI forums
- Forums
- Get Help with Power BI
- DAX Commands and Tips
- Re: How to calculate average length of employement...
- Subscribe to RSS Feed
- Mark Topic as New
- Mark Topic as Read
- Float this Topic for Current User
- Bookmark
- Subscribe
- Printer Friendly Page
- Mark as New
- Bookmark
- Subscribe
- Mute
- Subscribe to RSS Feed
- Permalink
- Report Inappropriate Content
How to calculate average length of employement, per year?
Hi all,
i'm trying to show in a dashboard the average employee length per year. At first, I had simply worked out the difference between everyone's start and end date and displayed this as an average, but I realised that this wasn't accounting for the number of employees in any given year.
E.g if a company only had 1 person working for them and they joined in 1990 and left in 1995, although they stayed for 5 years, in any given year between 1990 - 1995, their average length of stay would only be 1 year.
My data is pretty simple and has the following fields:
| Employee ID | Start date | End date | Length of stay (months) |
| 1 | 01/10/2020 | 01/12/2020 | 2 |
| 2 | 12/02/2020 | 06/04/2020 | 1 |
| 3 | 15/05/2020 | 20/05/2012 | 24 |
| 4 | 06/08/2008 | 07/10/2010 | 26 |
Is there a way to calculate this? I'm a bit lost with it right now.
Many thanks,
Solved! Go to Solution.
- Mark as New
- Bookmark
- Subscribe
- Mute
- Subscribe to RSS Feed
- Permalink
- Report Inappropriate Content
@Anonymous
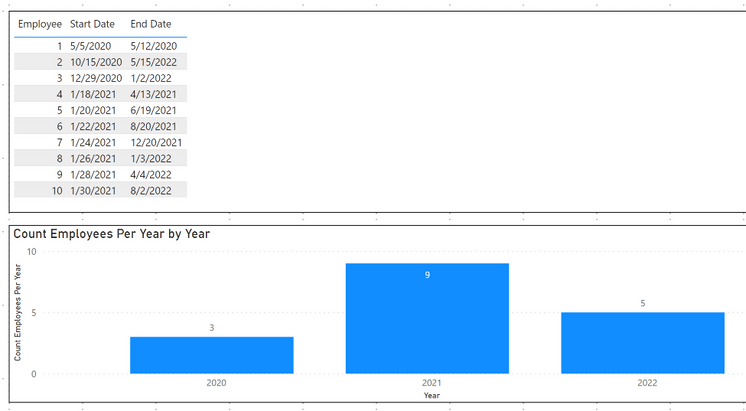
The following measure will give you the count of employees per year.
I have not yet done the other calculations:
- SUM of total employed months per year
- AVG employed months per year.
Let me know if I'm on the right path.
Regards,
Nathan
- Mark as New
- Bookmark
- Subscribe
- Mute
- Subscribe to RSS Feed
- Permalink
- Report Inappropriate Content
@Anonymous
So glad the questions & measure were helpful to you!
I'm a bit relieved actually, because I have been stuck on the next step.
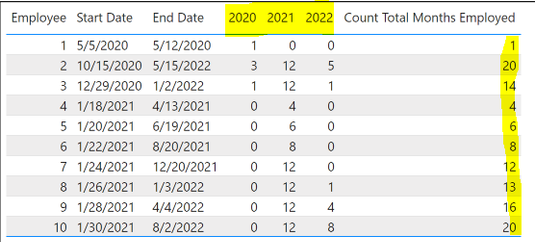
I can calculate the SUM of total months employed for each row.
However, this needs to be separated by year to be able to calculate the yearly average; which I cannot figure out.
[1] Total Num Employees for each year --I HAVE THIS
[2] Total Num Employed Months for each year --I CANNOT GET THIS
[3] Avg Months Employeed for each year = [2] / [1]
For example, the following measure gives me the correct number of total months employed for each line.
But I can't separate it by year (like the manual Excel columns: 2020, 2021, 2022).
Would you educate me on how you did this?
Regards,
Nathan
- Mark as New
- Bookmark
- Subscribe
- Mute
- Subscribe to RSS Feed
- Permalink
- Report Inappropriate Content
@Anonymous
The following measure will give you the count of employees per year.
I have not yet done the other calculations:
- SUM of total employed months per year
- AVG employed months per year.
Let me know if I'm on the right path.
Regards,
Nathan
- Mark as New
- Bookmark
- Subscribe
- Mute
- Subscribe to RSS Feed
- Permalink
- Report Inappropriate Content
@Anonymous
If partial months count as full months, and those employees count toward the number of employees in the given year, then I'm understanding the calculation to be as follows. Does this look right to you?
Regards,
Nathan
- Mark as New
- Bookmark
- Subscribe
- Mute
- Subscribe to RSS Feed
- Permalink
- Report Inappropriate Content
@Anonymous
No worries at all.
What I still don't understand is if a partial month counts as a full month or not.
Examples:
1) If employment only lasts 1 week in a given month (e.g. May 5-12):
- Does this count as 1 month of employment towards the average? Or does it count as 0?
- Does this specific employee get counted as an employee for that specific year?
2) If employment starts at the end of the year (e.g. 29-DEC-2020):
- Does the full month of DEC 2020 count as 1 employed month?
- Does this specific employee get counted as an employee in the year 2020?
3) If employment ends at the beginning of any month (e.g. 2-SEP), should that month (e.g. September) be counted as a month of employment towards the average?
Regards,
Nathan
- Mark as New
- Bookmark
- Subscribe
- Mute
- Subscribe to RSS Feed
- Permalink
- Report Inappropriate Content
Hi Nathan,
Thank you again for your time and help with this.
The questions you ask have helped me to understand what I'm trying to get from the data. But using the measure you provided and adapting that to my data did just the trick of what I was trying to get to.
Thank you so much !!
- Mark as New
- Bookmark
- Subscribe
- Mute
- Subscribe to RSS Feed
- Permalink
- Report Inappropriate Content
Hello @Anonymous
Could you help me understand a bit more?
1) Row 1 is from 1-OCT-20 to 1-DEC-20. This should be 2 months, yet Length of Stay shows 12. Am I missing something?
2) Row 2 "Length of Stay" shows as 2. Is this correct?
- 12-Feb-20 to 6-APR-20 should be less than 2 months. (i.e. it should be "1". Or is this not correct?
3) Row 3 "End Date" is 20-May-2012. Is this a typo?
- If not, the end date is roughly 9 years before the start date.
- What should the end year, and length of stay be for this row?
Regards,
Nathan
- Mark as New
- Bookmark
- Subscribe
- Mute
- Subscribe to RSS Feed
- Permalink
- Report Inappropriate Content
Hi Nathan,
Many thanks for your reply. Sorry, when I was trying to put in some example data, the format just kept jumping around. This is only an example I quickly tried to put together based on my actual data.
Thanks
Helpful resources
| User | Count |
|---|---|
| 15 | |
| 8 | |
| 6 | |
| 6 | |
| 6 |
| User | Count |
|---|---|
| 23 | |
| 14 | |
| 13 | |
| 8 | |
| 8 |


