FabCon is coming to Atlanta
Join us at FabCon Atlanta from March 16 - 20, 2026, for the ultimate Fabric, Power BI, AI and SQL community-led event. Save $200 with code FABCOMM.
Register now!- Power BI forums
- Get Help with Power BI
- Desktop
- Service
- Report Server
- Power Query
- Mobile Apps
- Developer
- DAX Commands and Tips
- Custom Visuals Development Discussion
- Health and Life Sciences
- Power BI Spanish forums
- Translated Spanish Desktop
- Training and Consulting
- Instructor Led Training
- Dashboard in a Day for Women, by Women
- Galleries
- Data Stories Gallery
- Themes Gallery
- Contests Gallery
- QuickViz Gallery
- Quick Measures Gallery
- Visual Calculations Gallery
- Notebook Gallery
- Translytical Task Flow Gallery
- TMDL Gallery
- R Script Showcase
- Webinars and Video Gallery
- Ideas
- Custom Visuals Ideas (read-only)
- Issues
- Issues
- Events
- Upcoming Events
The Power BI Data Visualization World Championships is back! Get ahead of the game and start preparing now! Learn more
- Power BI forums
- Forums
- Get Help with Power BI
- DAX Commands and Tips
- How does CALUCLATE merge the filter arguments of w...
- Subscribe to RSS Feed
- Mark Topic as New
- Mark Topic as Read
- Float this Topic for Current User
- Bookmark
- Subscribe
- Printer Friendly Page
- Mark as New
- Bookmark
- Subscribe
- Mute
- Subscribe to RSS Feed
- Permalink
- Report Inappropriate Content
How does CALUCLATE merge the filter arguments of which one is a table and the other is a column
Hi~Dear PowerBI community
I met a scenario that got some results I couldn't explain well, making me doute and confused. I think there must be something wrong in my understanding about how CALCULATE merge the filter arguments. I've done all I can but failed to figure it out.
Let me try to show this question, hoping someone would give me some hints.
----
There are two tables : <Dfact> and <Ddim> , and a relationship between them
<Dfact>
| ID | SubCategory |
| 1 | SC1 |
| 2 | SC1 |
| 3 | SC2 |
| 4 | SC2 |
| 5 | SC3 |
| 6 | SC3 |
<Ddim>
| Category | SubCategory |
| C1 | SC1 |
| C1 | SC2 |
| C2 | SC3 |
| C2 | SC4 |
| C3 | SC5 |
I've learned that when a table is transformed in a filter, the filter contains the expanded version of the table. Therefore, the following measure calculates the number of <Ddim> referenced in the <Dfact> table:
CALCULATE ( COUNTROWS(Ddim), Dfact)
Then I added an additional column filter argument and got the same result:
CALCULATE ( COUNTROWS( Ddim ), Dfact, Dfact[SubCategory] = "SC1" )
I was trying to make analyses of the filter context and I knew I could explain it as below:
the columns filter used as the second argument is a column not a table, and there's no such a column in the expanded version of <Ddim> table, so the column filter won't filter the <Ddim> table . While the first augument <Dfact> can filter the <Ddim> due to the expanded version of the <Dfact> table.
But things got wired while I analyzed it another way with more detail into the merge of the filter arguments.
I read The Definitive Guide to DAX and it told me these:
- The multiple filter arguments of CALCULATE are always merged with a logical AND.
- CALCULATE merges its filter arguments with an intersection.
Given two filter contexts, A and B, the intersection of A and B is computed by adding the filters in A to the filters in B.
According to these rules, I analysed it as below:
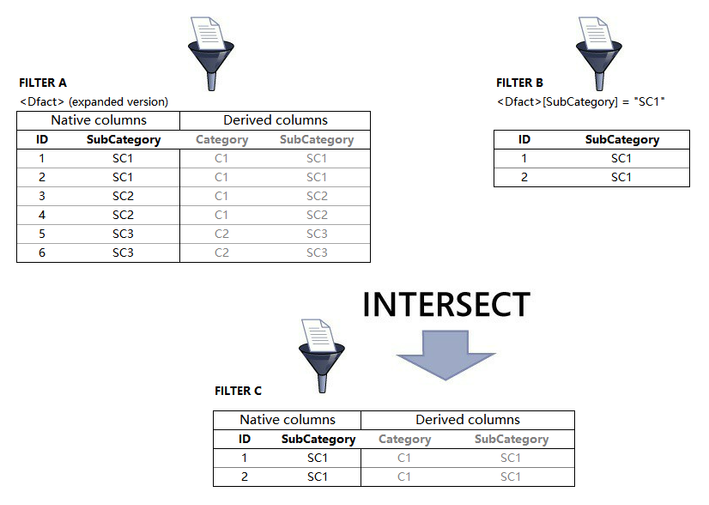
FILTER A (the first augument):
Dfact (expanded version containing all the columns of <Ddim>), a table with many columns
FILTER B (the second augument):
Dfact[SubCategory]="SC1" or FILTER(ALL(Dfact[SubCategory]), Dfact[SubCategory] = "SC1"), a table with only one column
If I add filters B to filters A, I will get the result filter C as below, is it right?
If I were right, the first argument of CALCULATE should be calculated in this new filter context and get a result as 1( only one row contains "SC1" in <Ddim>), which is completely different from the previous result as 3 .
So there must be something wrong in my understanding about how CALCULATE merge the filter arguments, even worse about what the filter really is.
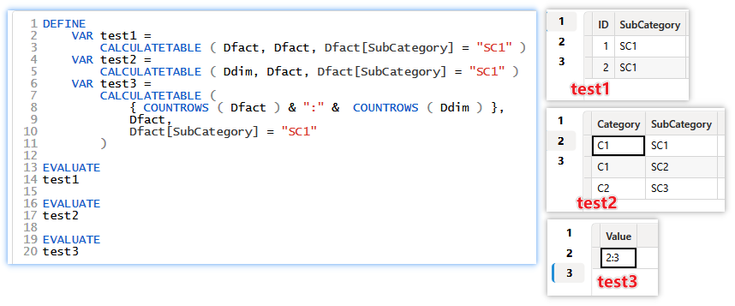
I tried some tests and got these results
The result of test1 is the table <Dfact> with only "SC1" in the rows, identical to the analysis by merge filter argument above.
The result of test2 is the table <Ddim> with the subcategories referenced in the <Dfact> table, identical to the analysis by the expanded talbe and filter propagation.
The result of test3 shows the number of rows of <Dfact> and <Ddim> in the exactly identical filter context.
I thought CALCULATE creates the new filter context before caluclates the first argument, but the result of test3 confused me more, wandering are there two filter contexts affecting the two COUNTROWS respectively ?
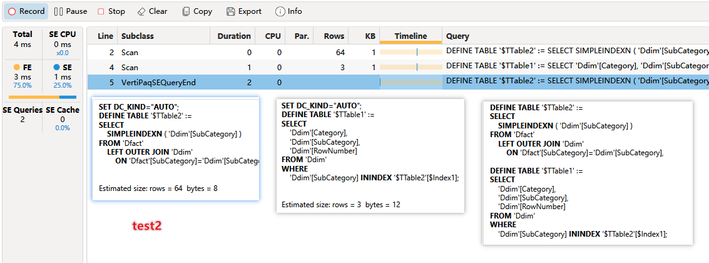
Furthermore, I checked the SE queries, there was "[SubCategory] = 'SC1' " in the WHERE statement of the xmSQL of test1, whereas in the xmSQL of test2, "[SubCategory] = 'SC1' " is totally discarded in the 3 SE queries.
I can't get more useful information in the SE query, cause I knew few about it.
I got stuck here.
Please give me some helps.
Solved! Go to Solution.
- Mark as New
- Bookmark
- Subscribe
- Mute
- Subscribe to RSS Feed
- Permalink
- Report Inappropriate Content
Hi @RandVac ,
That's the correct way for you to interpret it.
【he columns filter used as the second argument is a column not a table, and there's no such a column in the expanded version of <Ddim> table, so the column filter won't filter the <Ddim> table . While the first augument <Dfact> can filter the <Ddim> due to the expanded version of the <Dfact> table.】
Another way of understanding the confusion brought to you is due to the fact that you have forgotten the following precautions:
Note: The internal filters of the CALCULATE function are calculated independently of each other and do not affect each other, so table filters are not filtered by column filters. Moreover, the intersection of the filters produces Cartesian product combinations and does not filter any combinations. Note the distinction between filters and tables.
Did I answer your question? If yes, pls mark my post as a solution and appreciate your Kudos !
Thank you~
- Mark as New
- Bookmark
- Subscribe
- Mute
- Subscribe to RSS Feed
- Permalink
- Report Inappropriate Content
sorry, made a mistake in one image:
There is only one column in FILTER B as below
Helpful resources

Power BI Monthly Update - November 2025
Check out the November 2025 Power BI update to learn about new features.

Fabric Data Days
Advance your Data & AI career with 50 days of live learning, contests, hands-on challenges, study groups & certifications and more!

| User | Count |
|---|---|
| 20 | |
| 10 | |
| 9 | |
| 4 | |
| 4 |
| User | Count |
|---|---|
| 33 | |
| 31 | |
| 19 | |
| 12 | |
| 10 |


