This time we’re going bigger than ever. Fabric, Power BI, SQL, AI and more. We're covering it all. You won't want to miss it.
Learn moreLevel up your Power BI skills this month - build one visual each week and tell better stories with data! Get started
Hi Guys,
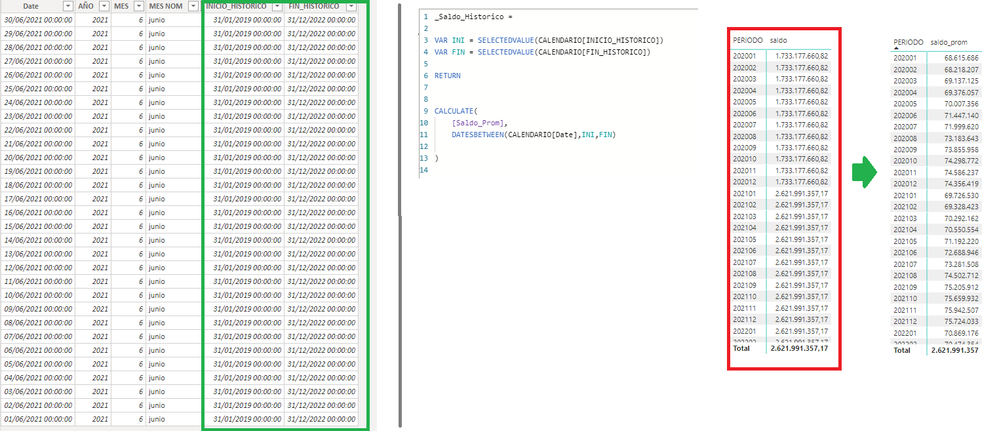
I need to calculate the sales per month between 2 dates, I created in the calendar table two columns with the maximum date and the minimum date, I also created a measure with the datebetween function with the dates but the result is the accumulated sales and it should be shown per month .
any suggestions, thanks guys.
Solved! Go to Solution.
Does it do what you expect if you use KEEPFILTERS to prevent DATESBETWEEN from overriding the month?
Saldo =
VAR INI = SELECTEDVALUE ( CALENDARIO[INICIO_HISTORICO] )
VAR FIN = SELECTEDVALUE ( CALENDARIO[FIN_HISTORICO] )
RETURN
CALCULATE (
[Saldo_Prom],
KEEPFILTERS ( DATESBETWEEN ( CALENDARIO[Date], INI, FIN ) )
)
Does it do what you expect if you use KEEPFILTERS to prevent DATESBETWEEN from overriding the month?
Saldo =
VAR INI = SELECTEDVALUE ( CALENDARIO[INICIO_HISTORICO] )
VAR FIN = SELECTEDVALUE ( CALENDARIO[FIN_HISTORICO] )
RETURN
CALCULATE (
[Saldo_Prom],
KEEPFILTERS ( DATESBETWEEN ( CALENDARIO[Date], INI, FIN ) )
)
Check out the April 2026 Power BI update to learn about new features.
Sign up to receive a private message when registration opens and key events begin.
If you have recently started exploring Fabric, we'd love to hear how it's going. Your feedback can help with product improvements.
| User | Count |
|---|---|
| 4 | |
| 4 | |
| 3 | |
| 3 | |
| 3 |
| User | Count |
|---|---|
| 9 | |
| 8 | |
| 8 | |
| 6 | |
| 6 |