FabCon is coming to Atlanta
Join us at FabCon Atlanta from March 16 - 20, 2026, for the ultimate Fabric, Power BI, AI and SQL community-led event. Save $200 with code FABCOMM.
Register now!- Power BI forums
- Get Help with Power BI
- Desktop
- Service
- Report Server
- Power Query
- Mobile Apps
- Developer
- DAX Commands and Tips
- Custom Visuals Development Discussion
- Health and Life Sciences
- Power BI Spanish forums
- Translated Spanish Desktop
- Training and Consulting
- Instructor Led Training
- Dashboard in a Day for Women, by Women
- Galleries
- Data Stories Gallery
- Themes Gallery
- Contests Gallery
- Quick Measures Gallery
- Visual Calculations Gallery
- Notebook Gallery
- Translytical Task Flow Gallery
- TMDL Gallery
- R Script Showcase
- Webinars and Video Gallery
- Ideas
- Custom Visuals Ideas (read-only)
- Issues
- Issues
- Events
- Upcoming Events
Calling all Data Engineers! Fabric Data Engineer (Exam DP-700) live sessions are back! Starting October 16th. Sign up.
- Power BI forums
- Forums
- Get Help with Power BI
- DAX Commands and Tips
- Help Please!: Calculate Difference from Previous D...
- Subscribe to RSS Feed
- Mark Topic as New
- Mark Topic as Read
- Float this Topic for Current User
- Bookmark
- Subscribe
- Printer Friendly Page
- Mark as New
- Bookmark
- Subscribe
- Mute
- Subscribe to RSS Feed
- Permalink
- Report Inappropriate Content
Help Please!: Calculate Difference from Previous Date (Dates Are Missing)
Hi Everyone, Appreciate joining the community as a novice PBI user and any help that could be provided.
I have been trying to calculate the difference for rows in a table regarding cumulative death data in descending order related to a certain condition for multiple locations (called "a", "b", "c", "d", and "e" for this inquiry). Unfortunately, dates are skipped, so that only Sunday, Monday, Tuesday, Wednesday, and Thursday only have data (in most cases)--this is not always consistent.
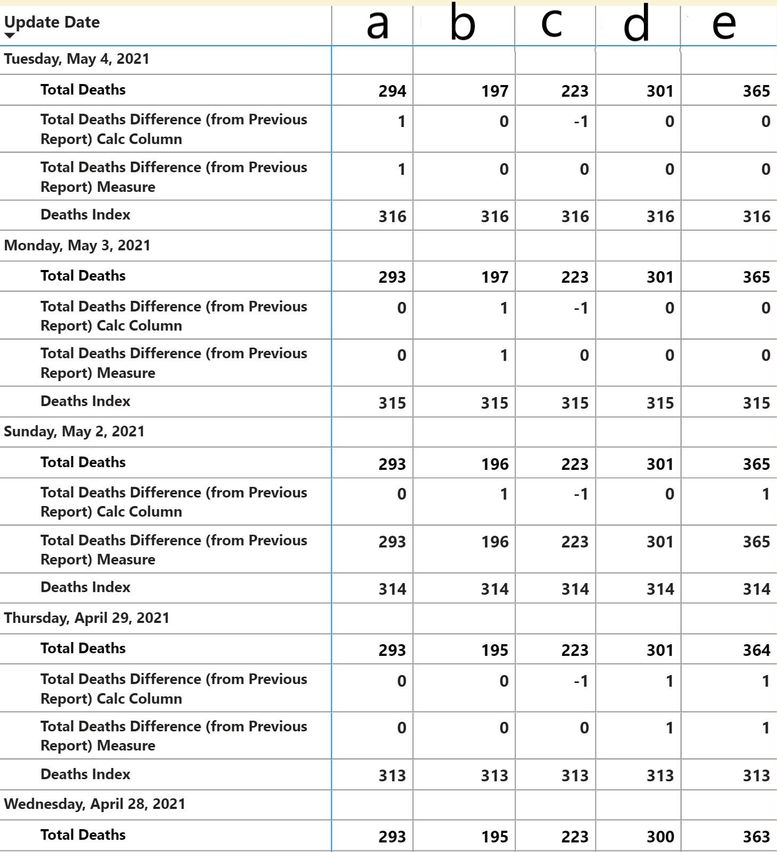
I've tried doing this many, many ways via a Calculated Column (i.e., "Total Deaths Difference (from Previous Report) Calc Column") versus Measure (i.e., "Total Deaths Difference (from Previous Report) Measure") to get the difference, but for the Measure method it gets caught up in the jump from Thursday to Sunday data (as there is no consecutive dates in between) and provides the MAX value and not a difference using Thursday's data (look at Sunday, May 2). For the Calculated Column and although you cannot see it, it keeps using the MAX value, which with this data, sometimes rolls-back to a lower value or stays the same and the difference result comes out incorrect as a result of this.
Here are the DAX formulas that I am referring to:
Measure:
Measure =
CALCULATE(MAX('Table'[Total Deaths])) - CALCULATE(MAX('Table'[Total Deaths]), PREVIOUSDAY('Table'[Update Date]))
Calculated Column:
Calculated Column =
VAR _dates = 'Table'[Update Date]
VAR _PrevRow =
CALCULATE(
MAX('Table'[Total Deaths]),
FILTER('Table',
'Table'[Update Date]<_dates))
return
[Total Deaths]- _PrevRow
Here is a copy of the data table via a Matrix that I made:
I added an Index Column just for my reference and in an another attempt to process the data, so you can ignore this as I want to keep this simple as there must be a one-step way to fix my current DAX to adjust for the missing dates! I'm assuming some sort of FILTER needs to be applied to tell the software to skip Friday and Sunday or at least a logic function telling it that if a date doesn't exist to keep going back until it finds one that does.
Curbal had something on this in a video, but it just didn't address the potential for interrupted/missing dates and was under the presumption that the MAX value was always the most recent/newest cumulative total, which is not always the case as data sometimes gets rolled back as deaths might be reclassified/removed. Here's the link if this is helpful: https://www.youtube.com/watch?v=mLZ4KISPcZ8
Any input would be appreciated. Let me know if I need to clarify something. Thank you!
- Mark as New
- Bookmark
- Subscribe
- Mute
- Subscribe to RSS Feed
- Permalink
- Report Inappropriate Content
new column =
var _max = maxx(filter(Table, [Update Date] <earlier([Update Date])),[Update Date])
return
[Total Deaths] - sumx(filter(Table, [Update Date] =_max),[Total Deaths])
a measure with date table for last available date
Last Day Non Continuous = CALCULATE(sum([Total Deaths]),filter(ALLSELECTED('Date'),'Date'[Date] =MAXX(FILTER(ALLSELECTED('Date'),'Date'[Date]<max('Date'[Date])),'Date'[Date])))
Day Intelligence - Last day, last non continous day
https://medium.com/@amitchandak.1978/power-bi-day-intelligence-questions-time-intelligence-5-5-5c324...
Helpful resources

FabCon Global Hackathon
Join the Fabric FabCon Global Hackathon—running virtually through Nov 3. Open to all skill levels. $10,000 in prizes!

Power BI Monthly Update - October 2025
Check out the October 2025 Power BI update to learn about new features.

| User | Count |
|---|---|
| 12 | |
| 11 | |
| 9 | |
| 9 | |
| 8 |

