Fabric Data Days starts November 4th!
Advance your Data & AI career with 50 days of live learning, dataviz contests, hands-on challenges, study groups & certifications and more!
Get registered- Power BI forums
- Get Help with Power BI
- Desktop
- Service
- Report Server
- Power Query
- Mobile Apps
- Developer
- DAX Commands and Tips
- Custom Visuals Development Discussion
- Health and Life Sciences
- Power BI Spanish forums
- Translated Spanish Desktop
- Training and Consulting
- Instructor Led Training
- Dashboard in a Day for Women, by Women
- Galleries
- Data Stories Gallery
- Themes Gallery
- Contests Gallery
- Quick Measures Gallery
- Visual Calculations Gallery
- Notebook Gallery
- Translytical Task Flow Gallery
- TMDL Gallery
- R Script Showcase
- Webinars and Video Gallery
- Ideas
- Custom Visuals Ideas (read-only)
- Issues
- Issues
- Events
- Upcoming Events
Get Fabric Certified for FREE during Fabric Data Days. Don't miss your chance! Learn more
- Power BI forums
- Forums
- Get Help with Power BI
- DAX Commands and Tips
- HELP WITH SUM FORMULA
- Subscribe to RSS Feed
- Mark Topic as New
- Mark Topic as Read
- Float this Topic for Current User
- Bookmark
- Subscribe
- Printer Friendly Page
- Mark as New
- Bookmark
- Subscribe
- Mute
- Subscribe to RSS Feed
- Permalink
- Report Inappropriate Content
HELP WITH SUM FORMULA
I need urgent help on a SUM formula please!
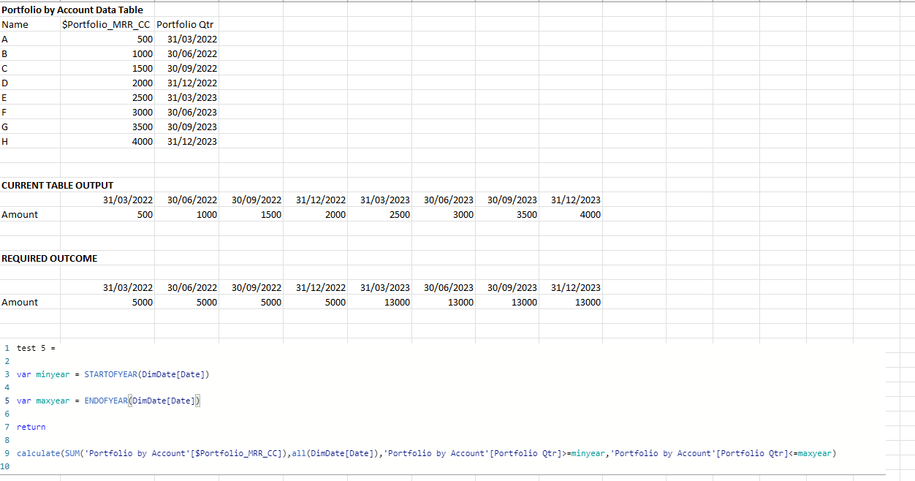
I am trying to make a matrix table which sums up a number for the entire year, even when the table shows quarterly periods.
For example, there is $5k of sales to renew across the whole of 2022, with differing amounts per quarter. I would like the output of my formula to show $5k for each of the quarters and not their individual portfolio . I have added the formula below which I thought should work.
I have added a summary of the data below, thanks in advance!
Solved! Go to Solution.
- Mark as New
- Bookmark
- Subscribe
- Mute
- Subscribe to RSS Feed
- Permalink
- Report Inappropriate Content
hi @robg89
try to plot the a like:
Amount =
CALCULATE(
	SUM(Table1[Portfolio]),
	FILTER(
		ALL(Table1[Qtr]),
		YEAR(Table1[Qtr])=YEAR(MAX(Table1[Qtr]))
	)
)
- Mark as New
- Bookmark
- Subscribe
- Mute
- Subscribe to RSS Feed
- Permalink
- Report Inappropriate Content
hi @robg89
try to plot the a like:
Amount =
CALCULATE(
	SUM(Table1[Portfolio]),
	FILTER(
		ALL(Table1[Qtr]),
		YEAR(Table1[Qtr])=YEAR(MAX(Table1[Qtr]))
	)
)
- Mark as New
- Bookmark
- Subscribe
- Mute
- Subscribe to RSS Feed
- Permalink
- Report Inappropriate Content
After looking at the data again, I still need help. If I look at it by month, the months where there are no portfolios are blank, I need these to also show $5k. Can you please help?
- Mark as New
- Bookmark
- Subscribe
- Mute
- Subscribe to RSS Feed
- Permalink
- Report Inappropriate Content
- Mark as New
- Bookmark
- Subscribe
- Mute
- Subscribe to RSS Feed
- Permalink
- Report Inappropriate Content
The data hasn't changed. I am trying to look at the portfolio values monthly therefore in the above example, I would like to see $5k in every month.
To put in to practical terms, at the start of the year (opening portfolio) I have $5k,this renews across 4 quarters. Every month we have sales adding to the portfolio but I want the opening portfolio to stay the same,
- Mark as New
- Bookmark
- Subscribe
- Mute
- Subscribe to RSS Feed
- Permalink
- Report Inappropriate Content
hi @robg89
then you need another table, with all the MonthEndDate and connected with your datatable.
Feed your visual with MonthEndDate column.
Helpful resources

Fabric Data Days
Advance your Data & AI career with 50 days of live learning, contests, hands-on challenges, study groups & certifications and more!

Power BI Monthly Update - October 2025
Check out the October 2025 Power BI update to learn about new features.

| User | Count |
|---|---|
| 8 | |
| 5 | |
| 5 | |
| 4 | |
| 3 |
| User | Count |
|---|---|
| 24 | |
| 11 | |
| 11 | |
| 9 | |
| 8 |


