Join us at FabCon Vienna from September 15-18, 2025
The ultimate Fabric, Power BI, SQL, and AI community-led learning event. Save €200 with code FABCOMM.
Get registered- Power BI forums
- Get Help with Power BI
- Desktop
- Service
- Report Server
- Power Query
- Mobile Apps
- Developer
- DAX Commands and Tips
- Custom Visuals Development Discussion
- Health and Life Sciences
- Power BI Spanish forums
- Translated Spanish Desktop
- Training and Consulting
- Instructor Led Training
- Dashboard in a Day for Women, by Women
- Galleries
- Data Stories Gallery
- Themes Gallery
- Contests Gallery
- Quick Measures Gallery
- Notebook Gallery
- Translytical Task Flow Gallery
- TMDL Gallery
- R Script Showcase
- Webinars and Video Gallery
- Ideas
- Custom Visuals Ideas (read-only)
- Issues
- Issues
- Events
- Upcoming Events
Compete to become Power BI Data Viz World Champion! First round ends August 18th. Get started.
- Power BI forums
- Forums
- Get Help with Power BI
- DAX Commands and Tips
- Graphs Last 3 Months
- Subscribe to RSS Feed
- Mark Topic as New
- Mark Topic as Read
- Float this Topic for Current User
- Bookmark
- Subscribe
- Printer Friendly Page
- Mark as New
- Bookmark
- Subscribe
- Mute
- Subscribe to RSS Feed
- Permalink
- Report Inappropriate Content
Graphs Last 3 Months
Hello Team,
I was looking video(https://www.youtube.com/watch?v=d8Rm7dwM6gc) where we get last 6 months graph.
However in (14:49) they used Tabular Editor for calculation. Is it possible to get result without using Tabular Editor.
Kindly assist on the same.
Regards,
Chandrashekar B
Solved! Go to Solution.
- Mark as New
- Bookmark
- Subscribe
- Mute
- Subscribe to RSS Feed
- Permalink
- Report Inappropriate Content
Hello Amit,
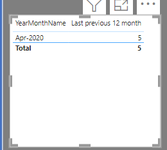
I tried below measure but still it is showing 1 month rather than 3 months.

- Mark as New
- Bookmark
- Subscribe
- Mute
- Subscribe to RSS Feed
- Permalink
- Report Inappropriate Content
@Chandrashekar , Check these two
Need of an Independent Date Table:https://www.youtube.com/watch?v=44fGGmg9fHI
https://bielite.com/blog/last-12-months-from-selected-date-trailing-12-months-ttm/
- Mark as New
- Bookmark
- Subscribe
- Mute
- Subscribe to RSS Feed
- Permalink
- Report Inappropriate Content
Hello Amit,
I got the solution and I missed to click drill down button.
Regards,
Chandrashekar B
- Mark as New
- Bookmark
- Subscribe
- Mute
- Subscribe to RSS Feed
- Permalink
- Report Inappropriate Content
Hello Amit,
I tried below measure but still it is showing 1 month rather than 3 months.

- Mark as New
- Bookmark
- Subscribe
- Mute
- Subscribe to RSS Feed
- Permalink
- Report Inappropriate Content
Hello Amit,
Can you please share pbix file as cannot able to download from link provided.
Regards,
Chandrashekar B
- Mark as New
- Bookmark
- Subscribe
- Mute
- Subscribe to RSS Feed
- Permalink
- Report Inappropriate Content
Hello Amit,
Thanks will check on it.
Regards,
Chandrashekar B
Helpful resources
| User | Count |
|---|---|
| 18 | |
| 8 | |
| 7 | |
| 6 | |
| 6 |
| User | Count |
|---|---|
| 27 | |
| 13 | |
| 12 | |
| 9 | |
| 8 |


