cancel
Showing results for 
Search instead for 
Did you mean: 

Level up your Power BI skills this month - build one visual each week and tell better stories with data! Get started

Reply
Weegreen
New Member

Giving ID to rows of dates

Hi all, 

Don't think this should be complicated but has me stuck! It is something I know I can achieve in PowerQuery but need the row numbers re-asessed based on slicer options so hence I believe it needs done as a DAX measure.


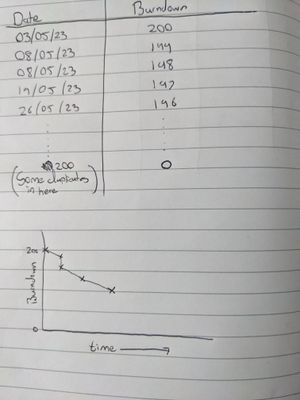
  • I have a list of dates which I need to order and rank as per pic, but when slicers are applied these numbers need to recalculate based on the range now available. There are duplicate dates in this list which need given numbers different to one another. The closest I have come is using RANX but whatever I get closed is aggregating dates that are the same. I drew a sketch for a friend as below (it is the 'Burndown' column I am trying to create), any help would be massively appreciated!!! 

PXL_20230519_063125490.jpg


3 REPLIES 3
some_bih
Community Champion
Community Champion

Hi @Weegreen I just saw that order of my picture should be reordered (1st should be 2nd lol). I still do not get your request. Maybe you should try my approach for start, with your data.

As I understand you need slice interaction, which is fine. Still, what is your input and wanted output? Give us some examples for input/output. 


Did I answer your question? Mark my post as a solution!

Proud to be a Super User!


some_bih
Community Champion
Community Champion

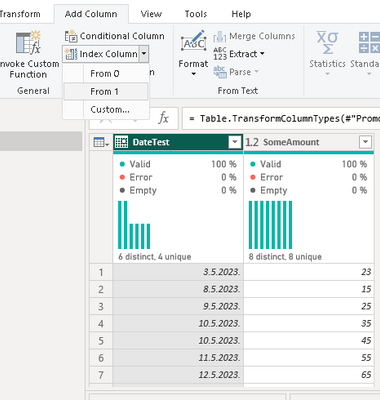
Hi @Weegreen  I am not sure what you need exactly, but if for part "There are duplicate dates in this list which need given numbers different to one another." you could in PQ insert index column (in my case starting from 1)


some_bih_0-1684490562110.png


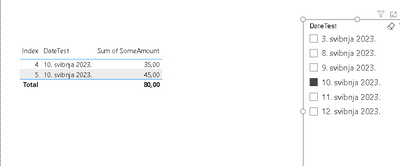
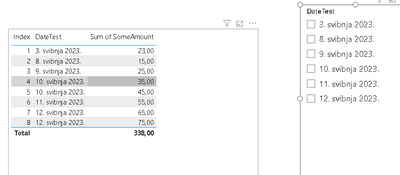
I created test data, so 10.5.2023 and 12.05.2023 are duplicate dates so first picture below is before slicing and second is for slicing one date 10.5.2023. I hope this help

some_bih_2-1684490685908.png


some_bih_1-1684490632672.png


Did I answer your question? Mark my post as a solution!

Proud to be a Super User!


Hi @some_bih,

Thanks for replying! If it helps clarify, what I mean by being re-indexed is in your first instance, the index would show 1 and 2. But in the second instance the index would show as it does in your photo. Does that clarify at all? 

Thanks 

Helpful resources

Announcements
April Power BI Update Carousel

Power BI Monthly Update - April 2026

Check out the April 2026 Power BI update to learn about new features.

Fabric SQL PBI Data Days

Data Days 2026 coming soon!

Sign up to receive a private message when registration opens and key events begin.

New to Fabric survey Carousel

New to Fabric Survey

If you have recently started exploring Fabric, we'd love to hear how it's going. Your feedback can help with product improvements.

Power BI DataViz World Championships carousel

Power BI DataViz World Championships - June 2026

A new Power BI DataViz World Championship is coming this June! Don't miss out on submitting your entry.