This time we’re going bigger than ever. Fabric, Power BI, SQL, AI and more. We're covering it all. You won't want to miss it.
Learn moreLevel up your Power BI skills this month - build one visual each week and tell better stories with data! Get started
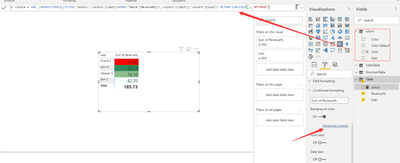
Hi everyone, I have got a table that has two columns user and revenue%. User information comes from one table and revenue% comes from the measure. I want to change the background color for each user based on conditions. I tried using conditional formatting but it just allowed me for the highest and minimum for everyone in the table. I want to change the color for each user based on certain conditions for them. I have attached one photo here for detailed info. Thank you
you need a measure to define which color to apply
Hi super user II, can you please show the snapshot of the colors table. Just confused about what to enter into those columns of the colors table. Thank you.
Sorry for giving you trouble. Just got one issue. Since my revenue% is a calculated measure I couldn't give it inside the MAX function. The following error came:
The MAX function only accepts a column reference as the argument number 1.
What would be the solution for this?
adding a var
var _revenue=[Revenue%]
then use it to replace max()
Please provide sample data in usable format (not as a picture) , and show the expected outcome.
The thing is like the user name comes from one table that has so many columns. And revenue is the calculated measure that takes several column values from different tables. How can I provide sample data for measure?
Check out the April 2026 Power BI update to learn about new features.
Sign up to receive a private message when registration opens and key events begin.
If you have recently started exploring Fabric, we'd love to hear how it's going. Your feedback can help with product improvements.
| User | Count |
|---|---|
| 5 | |
| 4 | |
| 3 | |
| 2 | |
| 2 |
| User | Count |
|---|---|
| 7 | |
| 6 | |
| 6 | |
| 5 | |
| 4 |