Fabric Data Days starts November 4th!
Advance your Data & AI career with 50 days of live learning, dataviz contests, hands-on challenges, study groups & certifications and more!
Get registered- Power BI forums
- Get Help with Power BI
- Desktop
- Service
- Report Server
- Power Query
- Mobile Apps
- Developer
- DAX Commands and Tips
- Custom Visuals Development Discussion
- Health and Life Sciences
- Power BI Spanish forums
- Translated Spanish Desktop
- Training and Consulting
- Instructor Led Training
- Dashboard in a Day for Women, by Women
- Galleries
- Data Stories Gallery
- Themes Gallery
- Contests Gallery
- Quick Measures Gallery
- Visual Calculations Gallery
- Notebook Gallery
- Translytical Task Flow Gallery
- TMDL Gallery
- R Script Showcase
- Webinars and Video Gallery
- Ideas
- Custom Visuals Ideas (read-only)
- Issues
- Issues
- Events
- Upcoming Events
Join us at FabCon Atlanta from March 16 - 20, 2026, for the ultimate Fabric, Power BI, AI and SQL community-led event. Save $200 with code FABCOMM. Register now.
- Power BI forums
- Forums
- Get Help with Power BI
- DAX Commands and Tips
- Filter a DAX measure with dynamic date filters / T...
- Subscribe to RSS Feed
- Mark Topic as New
- Mark Topic as Read
- Float this Topic for Current User
- Bookmark
- Subscribe
- Printer Friendly Page
- Mark as New
- Bookmark
- Subscribe
- Mute
- Subscribe to RSS Feed
- Permalink
- Report Inappropriate Content
Filter a DAX measure with dynamic date filters / Time Intelligence
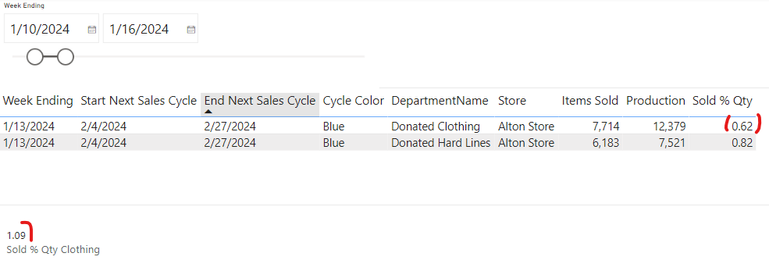
I need to filter a calculated table to find the metric for a particular department of goods and a dynamic date range. The Sales Cycle should have a Sold % Quantity which is the total items sold divided by the number of items produced.
These two numbers need to match:
This DAX is not working:
Sold % Qty Clothing =

VAR _startSalesCycle = DATE(2024, 02, 04)

VAR _endSalesCycle = DATE(2024, 02, 27)

CALCULATE(

    [Sold % Qty],

    'Production Units by Week'[DepartmentName] = "Donated Clothing",

    DATESINPERIOD(Dates[Date], _startSalesCycle, _endSalesCycle, DAY

    )

)
Eventually, I want the start and end of the Sales Cycle to determine how this table gets filtered on a weekly basis.
Which date filters should I use?
- Mark as New
- Bookmark
- Subscribe
- Mute
- Subscribe to RSS Feed
- Permalink
- Report Inappropriate Content
Hi @victoryamaykin ,
Thank you for the relevant description of your problem. Based on your description, I may not have a good understanding of your needs. I don't know what the three dates you show represent and how you'd like to filter them. Based on my understanding, I give you the following steps to achieve the desired effect.
To match the two numbers in your picture, I will show you the steps:
1.The test table Production Units by Week:
2.Modify the DAX code:
Sold % Qty Clothing =

LOOKUPVALUE('Production Units by Week'[Sold % Qty],'Production Units by Week'[DepartmentName],"Donated Clothing")
The DAX code can help you find the data what you want. Learn more about LOOKUPVALUE function (DAX) - DAX | Microsoft Learn.
3.The outcome is in the following picture.
To filter the data between Start Next Sales Cycle and End Next Sales Cycle ( I guess you want ), I will show you the steps:
1.The test table Date:
2. Right-click Production Units by Week, New Measure measure and input:
measure =
VAR _1 = IF(SELECTEDVALUE('Date'[Date]) < MAX([Start Next Sales Cycle]) || SELECTEDVALUE('Date'[Date]) > MAX([End Next Sales Cycle]), 0, 1)
RETURN
_1
3. Right-click Production Units by Week, New Measure Sold % Qty 1 and input:
Sold % Qty 1 = IF([measure] = 1 , MAX([Sold % Qty]))
4. The outcome is in the following pictures.
You can adjust the date logic as needed to fit your scenario. Learn more about Create a relative date slicer or filter in Power BI - Power BI | Microsoft Learn.
If you have any challenges or other issues implementing this solution, can you share the specific data ( including table and model ) you have used in text and image format? In addition to this, you also need to determine if there are any specific filters or slicers applied to the report, as this may affect this calculation. This will help diagnose the problem more effectively.
Best Regards,
Caroline Mei
If this post helps, then please consider Accept it as the solution to help the other members find it more quickly.
Helpful resources

FabCon Global Hackathon
Join the Fabric FabCon Global Hackathon—running virtually through Nov 3. Open to all skill levels. $10,000 in prizes!

Power BI Monthly Update - October 2025
Check out the October 2025 Power BI update to learn about new features.

| User | Count |
|---|---|
| 10 | |
| 6 | |
| 4 | |
| 3 | |
| 3 |
| User | Count |
|---|---|
| 13 | |
| 11 | |
| 8 | |
| 8 | |
| 8 |


