Join us at FabCon Vienna from September 15-18, 2025
The ultimate Fabric, Power BI, SQL, and AI community-led learning event. Save €200 with code FABCOMM.
Get registered- Power BI forums
- Get Help with Power BI
- Desktop
- Service
- Report Server
- Power Query
- Mobile Apps
- Developer
- DAX Commands and Tips
- Custom Visuals Development Discussion
- Health and Life Sciences
- Power BI Spanish forums
- Translated Spanish Desktop
- Training and Consulting
- Instructor Led Training
- Dashboard in a Day for Women, by Women
- Galleries
- Data Stories Gallery
- Themes Gallery
- Contests Gallery
- Quick Measures Gallery
- Notebook Gallery
- Translytical Task Flow Gallery
- TMDL Gallery
- R Script Showcase
- Webinars and Video Gallery
- Ideas
- Custom Visuals Ideas (read-only)
- Issues
- Issues
- Events
- Upcoming Events
Enhance your career with this limited time 50% discount on Fabric and Power BI exams. Ends September 15. Request your voucher.
- Power BI forums
- Forums
- Get Help with Power BI
- DAX Commands and Tips
- Re: FTE calculation
- Subscribe to RSS Feed
- Mark Topic as New
- Mark Topic as Read
- Float this Topic for Current User
- Bookmark
- Subscribe
- Printer Friendly Page
- Mark as New
- Bookmark
- Subscribe
- Mute
- Subscribe to RSS Feed
- Permalink
- Report Inappropriate Content
FTE calculation
Hi all,
I am looking for a DAX statement which returns the number of FTE given the context. For one month only, I have a solution (*), but for periods longer than 1 month I would like the measure to return the weighted average of FTE, so total hours worked / total workable hours in the selected months. The problem is level of aggregation I think, as the table contains one column for workable hours which only relates to month, while the hours worked relate to employee, type and category.
(*) SUMX( FILTER( Table ; [Type] = "Hours" ) ; Table[Amount] / Table[Workable hours] )
Your help is highly appreciated!
Regards,
Martin
Solved! Go to Solution.
- Mark as New
- Bookmark
- Subscribe
- Mute
- Subscribe to RSS Feed
- Permalink
- Report Inappropriate Content
@Anonymous
Your last post was extremely helpful.
Thank you very much for the expected results.
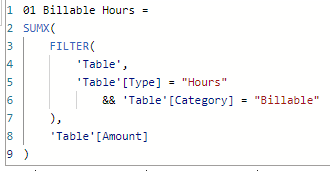
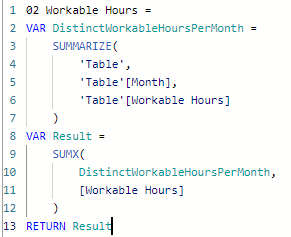
So you can combine these measures into one measure using variables. However, I've left them separate to show step by step. This is especially useful when testing pieces of DAX within the table visual results.
Step 1) Create a measure to get the Billable Hours
Step 2) Create a measure to get the Workable Hours
Step 3) Create a measure to Divide.
Billable Hours / Workable Hours
Results:
Regards,
Nathan
- Mark as New
- Bookmark
- Subscribe
- Mute
- Subscribe to RSS Feed
- Permalink
- Report Inappropriate Content
This seems to work properly! Thanks Nathan!
- Mark as New
- Bookmark
- Subscribe
- Mute
- Subscribe to RSS Feed
- Permalink
- Report Inappropriate Content
@Anonymous
Can you provide a mock visual example with the expected results (corresponding with your original table visual), which shows the period is longer than 1 month?
As you stated, the table visual originally provided has no row which is longer than 1 month, so the existing table visual does not satisfy the need.
Regards,
Nathan
- Mark as New
- Bookmark
- Subscribe
- Mute
- Subscribe to RSS Feed
- Permalink
- Report Inappropriate Content
@WinterMist , thanks for your quick response. I think my question is somewhat confusing. With "for periods longer than 1 month I would like the measure to return the weighted average of FTE" I meant, that when I would select multiple months in a report, the measure would return the weighted average of these months, rather than the sum of FTE's over the months.
- Mark as New
- Bookmark
- Subscribe
- Mute
- Subscribe to RSS Feed
- Permalink
- Report Inappropriate Content
@Anonymous
Thanks for clarifying. A couple more q's though.
When you "select multiple months in the report", do you mean that you are selecting months from a slicer? Or do you simply mean when multiple months are included in the filter context of the visual (like the screenshot shows)?
Would it be possible then to add to the existing visual (perhaps in Excel) a mock-up of what the expected values would be for this visual, when multiple months are selected?
Thanks,
Nathan
- Mark as New
- Bookmark
- Subscribe
- Mute
- Subscribe to RSS Feed
- Permalink
- Report Inappropriate Content
@WinterMist the table presented earlier is my source data. The output of the measure should return the highlighted values below. With the current DAX statement I get wrong FTE totals.
So the formula needs first needs to sum the hours in the filtercontext (i.e. Jan-Feb). For Employee A, billable hours, this is 160+160 =320 hours. Next, the measure needs to divide the sum by 176+160=336 workable hours for the month.
And also, for example, for total billable hours Jan (160+172+120) + Feb (160+148+152) = 912, the sum needs to be divided by 176+160=336 workable hours.
- Mark as New
- Bookmark
- Subscribe
- Mute
- Subscribe to RSS Feed
- Permalink
- Report Inappropriate Content
@Anonymous
Your last post was extremely helpful.
Thank you very much for the expected results.
So you can combine these measures into one measure using variables. However, I've left them separate to show step by step. This is especially useful when testing pieces of DAX within the table visual results.
Step 1) Create a measure to get the Billable Hours
Step 2) Create a measure to get the Workable Hours
Step 3) Create a measure to Divide.
Billable Hours / Workable Hours
Results:
Regards,
Nathan
Helpful resources
| User | Count |
|---|---|
| 14 | |
| 11 | |
| 8 | |
| 6 | |
| 5 |
| User | Count |
|---|---|
| 28 | |
| 19 | |
| 14 | |
| 8 | |
| 5 |


