Fabric Data Days starts November 4th!
Advance your Data & AI career with 50 days of live learning, dataviz contests, hands-on challenges, study groups & certifications and more!
Get registered- Power BI forums
- Get Help with Power BI
- Desktop
- Service
- Report Server
- Power Query
- Mobile Apps
- Developer
- DAX Commands and Tips
- Custom Visuals Development Discussion
- Health and Life Sciences
- Power BI Spanish forums
- Translated Spanish Desktop
- Training and Consulting
- Instructor Led Training
- Dashboard in a Day for Women, by Women
- Galleries
- Data Stories Gallery
- Themes Gallery
- Contests Gallery
- QuickViz Gallery
- Quick Measures Gallery
- Visual Calculations Gallery
- Notebook Gallery
- Translytical Task Flow Gallery
- TMDL Gallery
- R Script Showcase
- Webinars and Video Gallery
- Ideas
- Custom Visuals Ideas (read-only)
- Issues
- Issues
- Events
- Upcoming Events
Get Fabric Certified for FREE during Fabric Data Days. Don't miss your chance! Request now
- Power BI forums
- Forums
- Get Help with Power BI
- DAX Commands and Tips
- Re: Dynamic sized table showing current /previous ...
- Subscribe to RSS Feed
- Mark Topic as New
- Mark Topic as Read
- Float this Topic for Current User
- Bookmark
- Subscribe
- Printer Friendly Page
- Mark as New
- Bookmark
- Subscribe
- Mute
- Subscribe to RSS Feed
- Permalink
- Report Inappropriate Content
Dynamic sized table showing current /previous items
Help please. I want to show a list of the passengers for the selected taxi route/date, and a list of passengers for the same route the previous day. This list is not always the same length. I also want the table to be blank when no route is selected. Any help?
Currently I have 2 visuals
- First visual shows Table_journey_detail[RouteID] and Table_journey_detail[Date],
- Second visual shows only Table_individual_details[PersonID]
I have 2 problems with this 1) when no route/date is selected on the first visual, the second visual shows every possible PersonID, and 2) my previous passenger list is showing current passengers.
NOTE: I cannot use concatenatex as I want selecting the PersonID to filter the first visual
Data Available
Table_journey_detail
Date | RouteID | _#Passengers | Cost | OtherData |
10/2/2020 | A1 | 3 | £6.00 | True |
10/2/2020 | B2 | 2 | £4.00 | False |
11/2/2020 | A1 | 4 | £7.00 | False |
11/2/2020 | B2 | 2 | £4.00 | True |
12/2/2020 | A1 | 3 | £6.00 | True |
Table_individual_details
Date | RouteID | PersonID | OtherData |
10/2/2020 | A1 | Ewan | Dc |
10/2/2020 | A1 | Niamh | Rb |
10/2/2020 | A1 | Cillian | Tyej |
10/2/2020 | B2 | Saiorse | Etuk |
10/2/2020 | B2 | Aodh | Ril |
11/2/2020 | A1 | Ewan | Il |
11/2/2020 | A1 | Aiofe | Yil |
11/2/2020 | A1 | Niamh | Hng |
11/2/2020 | A1 | Ciaran | iov |
11/2/2020 | B2 | Aisling | Ag |
11/2/2020 | B2 | Bronagh | ARG |
12/2/2020 | A1 | Brigid | Y |
12/2/2020 | A1 | Niamh | RYIYL |
12/2/2020 | A1 | Cillian | TUI |
Expected Output:
Journey selected – A1-10/2/2020
Most Recent Journey | Previous Journey |
Ewan |
|
Niamh |
|
Cillian |
|
Journey selected – A1-11/2/2020
Most Recent Journey | Previous Journey |
Ewan | Ewan |
Aiofe | Niamh |
Niamh | Cillian |
Ciaran |
|
Journey selected – A1-12/2/2020
Most Recent Journey | Previous Journey |
Brigid | Ewan |
Niamh | Aiofe |
Cillian | Niamh |
| Ciaran |
Journey selected – None (empty table)
Most Recent Journey | Previous Journey |
Solved! Go to Solution.
- Mark as New
- Bookmark
- Subscribe
- Mute
- Subscribe to RSS Feed
- Permalink
- Report Inappropriate Content
So here is the solution on how to make it so that nothing appears in
your output when both the Date & RouteID are not selected.
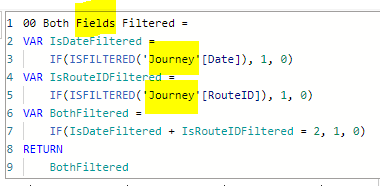
Step 1 - Create a measure to check if BOTH the Date AND RouteID are being filtered.
Step 2 - Select the "OUTPUT" table visual, and add the measure as a Filter on the visual.
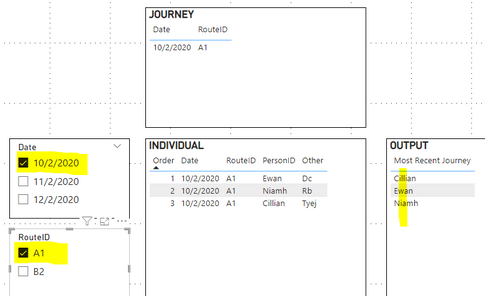
When the Date & RouteID are not selected, or only 1 of them is selected, no results are shown in the OUTPUT.
However, when both Date AND RouteID are selected, then the OUTPUT shows results:
NOTES:
- In this case, I am able to select the Journey (without using the slicers) and it still works, but that is because I'm only using a single table in the model for all the data. Depending on your model, you might not be able to do this, and be forced to use slicers.
- You will also notice that the output is sorted in alphabetical order. That's because per the data provided, there is nothing else to sort the name by. So it will not appear in the same order as it did in the full table.
Full Table Order: Ewan, Niamh, Cillian
OUTPUT Order: Cillian, Ewan, Niamh
I'll get back to you on the Previous Journey, but this should get you started.
Regards,
Nathan
- Mark as New
- Bookmark
- Subscribe
- Mute
- Subscribe to RSS Feed
- Permalink
- Report Inappropriate Content
Hi @CHaines
Please refer to attached sample file with the proposed solution. Hope this is what you're looking for
Most Recent Journey =
VAR CurrentIndex = SELECTEDVALUE ( 'Index'[Value] )
VAR T1 = VALUES ( individual_details[PersonID] )
VAR T2 =
    ADDCOLUMNS (
        T1,
        "@Index", RANKX ( T1, [PersonID],, ASC, Dense )
    )
VAR T3 = FILTER ( T2, [@Index] = CurrentIndex )
RETURN
    IF (
        HASONEVALUE ( journey_detail[Date] ) && HASONEVALUE ( journey_detail[RouteID] ),
        MAXX ( T3, [PersonID] )
    )
Previous Journey =
VAR CurrentIndex = SELECTEDVALUE ( 'Index'[Value] )
VAR CurrentDate = SELECTEDVALUE ( journey_detail[Date] )
VAR T1 =
CALCULATETABLE (
VALUES ( individual_details[PersonID] ),
REMOVEFILTERS ( ),
VALUES ( individual_details[RouteID] ),
individual_details[Date] = CurrentDate - 1
)
VAR T2 =
ADDCOLUMNS (
T1,
"@Index", RANKX ( T1, [PersonID],, ASC, Dense )
)
VAR T3 = FILTER ( T2, [@Index] = CurrentIndex )
RETURN
MAXX ( T3, [PersonID] )- Mark as New
- Bookmark
- Subscribe
- Mute
- Subscribe to RSS Feed
- Permalink
- Report Inappropriate Content
Some nifty work in here, thank you @tamerj1 ! It will take me a little while to figure out as well, but I think I'm getting the gist of what you've done here. It certainly works for displaing the current & previous values. I hope the product owner likes it XD
Sorry for moving the solution from you @WinterMist - it was a helpful guide and a tip to a functionality that I didn't know existed.
- Mark as New
- Bookmark
- Subscribe
- Mute
- Subscribe to RSS Feed
- Permalink
- Report Inappropriate Content
Brilliant, as usual. 🙂
I can see that it's working from your screenshots, but I'm going to have to study this one for a while.
Regards,
Nathan
- Mark as New
- Bookmark
- Subscribe
- Mute
- Subscribe to RSS Feed
- Permalink
- Report Inappropriate Content
Yes but caanot be used to filter the first visual as requested by the post originator.
- Mark as New
- Bookmark
- Subscribe
- Mute
- Subscribe to RSS Feed
- Permalink
- Report Inappropriate Content
Are you by chance able to share what the model looks like?
Are both these visuals just coming from 1 single table or from multiple tables?
Also, is it absolutely required that the first table visual be used to filter the second table visual? This doesn't always work as desired because you are filtering entire table rows rather than isolated fields. Would it be acceptable to use slicers for Date & RouteID instead?
Regards,
Nathan
- Mark as New
- Bookmark
- Subscribe
- Mute
- Subscribe to RSS Feed
- Permalink
- Report Inappropriate Content
Hi. Cheers for the questions. The 2 data tables are linked through a common merged column of rank(date)+RouteID in a many (Table_journey_detail) to one (Table_individual_details) relationship. RouteID and PersonID have a many to many relationship - a number of the peple take more than one route. Most routes have more than one person.
My end use datasets will likely have circa 10k routeIDs and circa 30k personIDs. We have a slicer for the date (good) and routeID (not so good) on the page: With so many RouteIDs, the slicer isn't useful for interogating the data this way. The product owner really wants the visuals to be crossfiltering like this as the "other data" will be used in each visual to filter the sets to find persons and journeys of interest. I can think of alternate ways of organising the page, but the product owner does not like them.
- Mark as New
- Bookmark
- Subscribe
- Mute
- Subscribe to RSS Feed
- Permalink
- Report Inappropriate Content
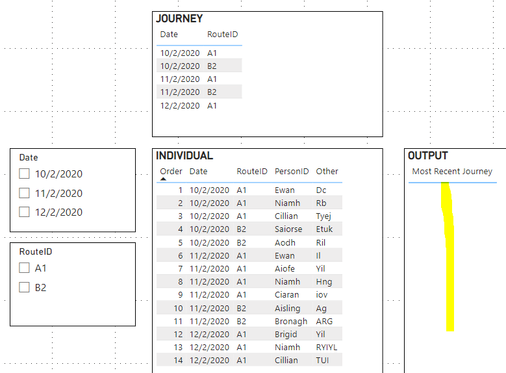
OK, I've taken the following steps to match your model...
1) Created a MergedKey calculated column for both 'Journey' & 'Individual' tables.
As a result, the tables now look like this...
'Journey'
'Individual'
2) Joined the 2 tables together in the model.
NOTE: You had mentioned that the 'Journey' table was the "many" side, but in my model it's the "1" side of the relationship. Hopefully I haven't completely messed this up.
3) Updated the "JOURNEY" table visual so that it now pulls from the 'Journey' data table (instead of previously pulling from the same 'Individual' table).
4) Updated the slicer filter measure created earlier to reference 'Journey' columns instead of 'Individual' columns.
5) Removed slicers from the solution to try to to meet the requirements.
NOTES:
- You can select any journey record from the JOURNEY table visual & it will filter the INDIVIDUAL table as well as the OUTPUT because filters flow from the 1-side ('Journey') to the *-side ('Individual'). So your original requirement works. But if you need to do the reverse (select an item in the INDIVIDUAL table visual to filter the JOURNEY table visual), that will not work with the current model.
Here is an example of your requirement to select a JOURNEY record & it properly shows the OUTPUT. In this example, I selected the JOURNEY record for: 11/2/2020 & A1. As mentioned previously the OUTPUT table is sorted alphabetically because no other option is available.
Regards,
Nathan
- Mark as New
- Bookmark
- Subscribe
- Mute
- Subscribe to RSS Feed
- Permalink
- Report Inappropriate Content
So here is the solution on how to make it so that nothing appears in
your output when both the Date & RouteID are not selected.
Step 1 - Create a measure to check if BOTH the Date AND RouteID are being filtered.
Step 2 - Select the "OUTPUT" table visual, and add the measure as a Filter on the visual.
When the Date & RouteID are not selected, or only 1 of them is selected, no results are shown in the OUTPUT.
However, when both Date AND RouteID are selected, then the OUTPUT shows results:
NOTES:
- In this case, I am able to select the Journey (without using the slicers) and it still works, but that is because I'm only using a single table in the model for all the data. Depending on your model, you might not be able to do this, and be forced to use slicers.
- You will also notice that the output is sorted in alphabetical order. That's because per the data provided, there is nothing else to sort the name by. So it will not appear in the same order as it did in the full table.
Full Table Order: Ewan, Niamh, Cillian
OUTPUT Order: Cillian, Ewan, Niamh
I'll get back to you on the Previous Journey, but this should get you started.
Regards,
Nathan
- Mark as New
- Bookmark
- Subscribe
- Mute
- Subscribe to RSS Feed
- Permalink
- Report Inappropriate Content
I had never before seen the option to add a filter to a visual like this. Fantastic stuff! I can construct a measure to place in here that uses something like the rank(date) -1 as I am using for other values. Amazing 😄
Helpful resources

Fabric Data Days
Advance your Data & AI career with 50 days of live learning, contests, hands-on challenges, study groups & certifications and more!

Power BI Monthly Update - October 2025
Check out the October 2025 Power BI update to learn about new features.

| User | Count |
|---|---|
| 8 | |
| 6 | |
| 5 | |
| 4 | |
| 3 |
| User | Count |
|---|---|
| 25 | |
| 16 | |
| 8 | |
| 8 | |
| 8 |


