FabCon is coming to Atlanta
Join us at FabCon Atlanta from March 16 - 20, 2026, for the ultimate Fabric, Power BI, AI and SQL community-led event. Save $200 with code FABCOMM.
Register now!- Power BI forums
- Get Help with Power BI
- Desktop
- Service
- Report Server
- Power Query
- Mobile Apps
- Developer
- DAX Commands and Tips
- Custom Visuals Development Discussion
- Health and Life Sciences
- Power BI Spanish forums
- Translated Spanish Desktop
- Training and Consulting
- Instructor Led Training
- Dashboard in a Day for Women, by Women
- Galleries
- Data Stories Gallery
- Themes Gallery
- Contests Gallery
- QuickViz Gallery
- Quick Measures Gallery
- Visual Calculations Gallery
- Notebook Gallery
- Translytical Task Flow Gallery
- TMDL Gallery
- R Script Showcase
- Webinars and Video Gallery
- Ideas
- Custom Visuals Ideas (read-only)
- Issues
- Issues
- Events
- Upcoming Events
The Power BI Data Visualization World Championships is back! Get ahead of the game and start preparing now! Learn more
- Power BI forums
- Forums
- Get Help with Power BI
- DAX Commands and Tips
- Dax measure to return missing text values in colum...
- Subscribe to RSS Feed
- Mark Topic as New
- Mark Topic as Read
- Float this Topic for Current User
- Bookmark
- Subscribe
- Printer Friendly Page
- Mark as New
- Bookmark
- Subscribe
- Mute
- Subscribe to RSS Feed
- Permalink
- Report Inappropriate Content
Dax measure to return missing text values in column within single table
Hi,
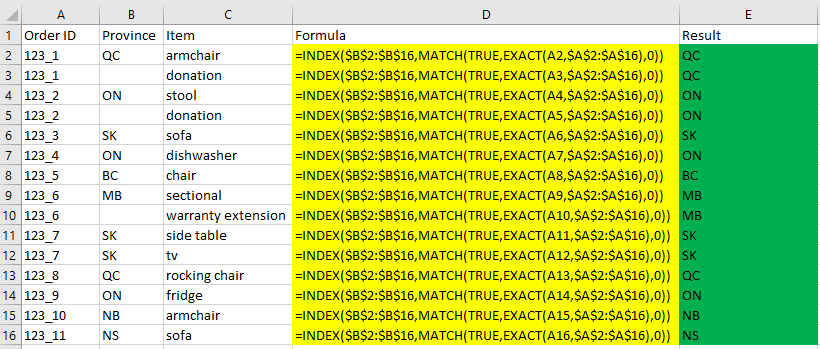
I need to replicate the following Excel formula in Power BI.
I have been trying a few things based on what I could find on the forum, but unfortunately nothing has worked so far.
The problem I'm facing is that the dataflow I'm working with does not carry forward some of the Province values for certain types of items (as shown in the example above). I am looking for a function that would allow me to carry forward those missing Province values and fill in the blanks.
Thanks for your help!
Solved! Go to Solution.
- Mark as New
- Bookmark
- Subscribe
- Mute
- Subscribe to RSS Feed
- Permalink
- Report Inappropriate Content
Hi @Anonymous
Please create a new calculated column
Result =
MAXX (
    CALCULATETABLE ( TableName, ALLEXCEPT ( TableName, TableName[OrderID] ) ),
    TableName[Province]
)- Mark as New
- Bookmark
- Subscribe
- Mute
- Subscribe to RSS Feed
- Permalink
- Report Inappropriate Content
Hi @Anonymous
Please create a new calculated column
Result =
MAXX (
    CALCULATETABLE ( TableName, ALLEXCEPT ( TableName, TableName[OrderID] ) ),
    TableName[Province]
)- Mark as New
- Bookmark
- Subscribe
- Mute
- Subscribe to RSS Feed
- Permalink
- Report Inappropriate Content
Hi @Anonymous
This is one of the simplest data transformations that Power Query does for you out of the box. It's about one mouse click away... There is a transformation in PQ called---if I remember right---Fill Down. Just use this and you'll be finished.
Helpful resources

Power BI Dataviz World Championships
The Power BI Data Visualization World Championships is back! Get ahead of the game and start preparing now!

Power BI Monthly Update - November 2025
Check out the November 2025 Power BI update to learn about new features.

| User | Count |
|---|---|
| 20 | |
| 11 | |
| 10 | |
| 4 | |
| 4 |
| User | Count |
|---|---|
| 32 | |
| 28 | |
| 19 | |
| 11 | |
| 10 |

