Join us at FabCon Vienna from September 15-18, 2025
The ultimate Fabric, Power BI, SQL, and AI community-led learning event. Save €200 with code FABCOMM.
Get registered- Power BI forums
- Get Help with Power BI
- Desktop
- Service
- Report Server
- Power Query
- Mobile Apps
- Developer
- DAX Commands and Tips
- Custom Visuals Development Discussion
- Health and Life Sciences
- Power BI Spanish forums
- Translated Spanish Desktop
- Training and Consulting
- Instructor Led Training
- Dashboard in a Day for Women, by Women
- Galleries
- Data Stories Gallery
- Themes Gallery
- Contests Gallery
- Quick Measures Gallery
- Notebook Gallery
- Translytical Task Flow Gallery
- TMDL Gallery
- R Script Showcase
- Webinars and Video Gallery
- Ideas
- Custom Visuals Ideas (read-only)
- Issues
- Issues
- Events
- Upcoming Events
Compete to become Power BI Data Viz World Champion! First round ends August 18th. Get started.
- Power BI forums
- Forums
- Get Help with Power BI
- DAX Commands and Tips
- DAX Measure not working properly
- Subscribe to RSS Feed
- Mark Topic as New
- Mark Topic as Read
- Float this Topic for Current User
- Bookmark
- Subscribe
- Printer Friendly Page
- Mark as New
- Bookmark
- Subscribe
- Mute
- Subscribe to RSS Feed
- Permalink
- Report Inappropriate Content
DAX Measure not working properly
Hello,
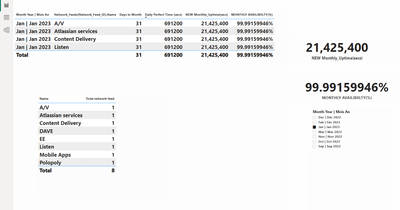
I am trying to figure out why this is happening. The numbers are all repeating.
Example for January
The only Network feed that should show this amount for availability issues is "Listen" but all the other 8 Network feeds should show 100% availability for running a perfect time of 24 hours per day which is, 691200 per second. Plus, only four Networks are showing, and it should be all eight network names from the table below.
Here is a snapshot of what I am seeing in my PBI report
These are the measures I wrote
This is the Excel spreadsheet and the same amounts that I am aiming for in PBI using the measures.
Daily perfect duration (secs) = SUM(Prime [Tot Hrs x Networks])*60*60 | 691200 | ||||||||||||||||||||||||||
Monthly perfect duration (secs) 28 days = DaysPerMonth x Daily Prime perfect duration (secs) | 19353600 | ||||||||||||||||||||||||||
Monthly perfect duration (secs) 30 days = DaysPerMonth x Daily Prime perfect duration (secs) | 20736000 | ||||||||||||||||||||||||||
Monthly perfect duration (secs) 31 days = DaysPerMonth x Daily Prime perfect duration (secs) | 21427200 | ||||||||||||||||||||||||||
| Test | |||||||||||||||||||||||||||
| January 2023 | Monthly error duration (secs) | 1800.00 | |||||||||||||||||||||||||
Monthly uptime (secs) = Monthly perfect duration (secs) - Monthly error duration (secs) | 21425400.00 | ||||||||||||||||||||||||||
Monthly Availability (%) = Monthly uptime (secs) / Monthly perfect duration (secs) x 100 | 99.99159946 | ||||||||||||||||||||||||||
All at 100% except Listen | 99.99159946 | ||||||||||||||||||||||||||
Solved! Go to Solution.
- Mark as New
- Bookmark
- Subscribe
- Mute
- Subscribe to RSS Feed
- Permalink
- Report Inappropriate Content
Can you share please your PBI with example data.
Did I answer your question? Mark my post as a solution!
Proud to be a Super User!
- Mark as New
- Bookmark
- Subscribe
- Mute
- Subscribe to RSS Feed
- Permalink
- Report Inappropriate Content
Can you share please your PBI with example data.
Did I answer your question? Mark my post as a solution!
Proud to be a Super User!


