Join us at FabCon Vienna from September 15-18, 2025
The ultimate Fabric, Power BI, SQL, and AI community-led learning event. Save €200 with code FABCOMM.
Get registered- Power BI forums
- Get Help with Power BI
- Desktop
- Service
- Report Server
- Power Query
- Mobile Apps
- Developer
- DAX Commands and Tips
- Custom Visuals Development Discussion
- Health and Life Sciences
- Power BI Spanish forums
- Translated Spanish Desktop
- Training and Consulting
- Instructor Led Training
- Dashboard in a Day for Women, by Women
- Galleries
- Data Stories Gallery
- Themes Gallery
- Contests Gallery
- Quick Measures Gallery
- Notebook Gallery
- Translytical Task Flow Gallery
- TMDL Gallery
- R Script Showcase
- Webinars and Video Gallery
- Ideas
- Custom Visuals Ideas (read-only)
- Issues
- Issues
- Events
- Upcoming Events
Compete to become Power BI Data Viz World Champion! First round ends August 18th. Get started.
- Power BI forums
- Forums
- Get Help with Power BI
- DAX Commands and Tips
- Cumulative total based on non unique dates AND tex...
- Subscribe to RSS Feed
- Mark Topic as New
- Mark Topic as Read
- Float this Topic for Current User
- Bookmark
- Subscribe
- Printer Friendly Page
- Mark as New
- Bookmark
- Subscribe
- Mute
- Subscribe to RSS Feed
- Permalink
- Report Inappropriate Content
Cumulative total based on non unique dates AND text filter
Hi - my table has non-unique dates and I'm trying to calculate a running total for a given date AND text filter pair. My data looks the equivalent of something like the below and what I'm aiming for is something like:
RunningTotal = calculate(sum('Table'[Revenue]) where WeekEndingDate <= Earlier(WeekEndingDate) AND Store = Store
Cumulative Revenue should calculate the running total of revenue for the row 'Store' up to the row 'WeekEndingDate'
Maybe I need ALLEXCEPT or ALLSELECTED but I can't quite get it to work. I've tried as many relative examples as I could find.
| WeekEndingDate | Store | Revenue | Cumulative Revenue |
| 7-Mar-21 | Strawberry Lane | $7.74 | |
| 14-Mar-21 | Strawberry Lane | $7.71 | |
| 21-Mar-21 | Strawberry Lane | $8.27 | |
| 28-Mar-21 | Strawberry Lane | $1.65 | |
| 4-Apr-21 | Strawberry Lane | $3.15 | |
| 11-Apr-21 | Strawberry Lane | $0.67 | |
| 18-Apr-21 | Strawberry Lane | $6.68 | |
| 25-Apr-21 | Strawberry Lane | $7.03 | |
| 2-May-21 | Strawberry Lane | $2.88 | |
| 9-May-21 | Strawberry Lane | $2.10 | |
| 16-May-21 | Strawberry Lane | $3.46 | |
| 23-May-21 | Strawberry Lane | $6.15 | |
| 30-May-21 | Strawberry Lane | $1.28 | |
| 6-Jun-21 | Strawberry Lane | $1.78 | |
| 13-Jun-21 | Strawberry Lane | $7.74 | |
| 11-Apr-21 | High St | $0.14 | |
| 18-Apr-21 | High St | $8.35 | |
| 25-Apr-21 | High St | $3.09 | |
| 2-May-21 | High St | $7.47 | |
| 9-May-21 | High St | $3.30 | |
| 16-May-21 | High St | $1.69 | |
| 23-May-21 | High St | $7.32 | |
| 30-May-21 | High St | $8.19 | |
| 6-Jun-21 | High St | $0.20 | |
| 13-Jun-21 | High St | $0.20 | |
| 28-Mar-21 | Mountain View | $5.70 | |
| 4-Apr-21 | Mountain View | $8.82 | |
| 11-Apr-21 | Mountain View | $9.32 | |
| 18-Apr-21 | Mountain View | $3.61 | |
| 25-Apr-21 | Mountain View | $3.80 | |
| 2-May-21 | Mountain View | $3.78 | |
| 9-May-21 | Mountain View | $5.51 | |
| 16-May-21 | Mountain View | $6.56 | |
| 23-May-21 | Mountain View | $8.85 | |
| 30-May-21 | Mountain View | $6.20 | |
| 6-Jun-21 | Mountain View | $6.35 | |
| 13-Jun-21 | Mountain View | $7.87 |
Solved! Go to Solution.
- Mark as New
- Bookmark
- Subscribe
- Mute
- Subscribe to RSS Feed
- Permalink
- Report Inappropriate Content
Hi @rack201
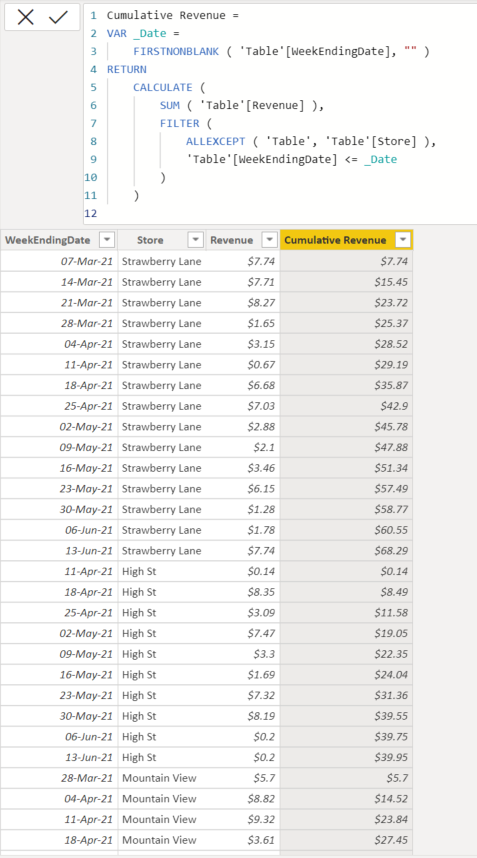
Try this code to add a column to your table:
Cumulative Revenue =
VAR _Date =
    FIRSTNONBLANK ( 'Table'[WeekEndingDate], "" )
RETURN
    CALCULATE (
        SUM ( 'Table'[Revenue] ),
        FILTER (
            ALLEXCEPT ( 'Table', 'Table'[Store] ),
            'Table'[WeekEndingDate] <= _Date
        )
    )
Output :
If this post helps, please consider accepting it as the solution to help the other members find it more quickly.
Appreciate your Kudos ✌️!!
- Mark as New
- Bookmark
- Subscribe
- Mute
- Subscribe to RSS Feed
- Permalink
- Report Inappropriate Content
Hello guys 😀
Code works perfektly thanks 💪
But any idea how to manipulate the code to calculate the average instead of sum?
Thanks for your contribution
Cheers
qwertzuiop
- Mark as New
- Bookmark
- Subscribe
- Mute
- Subscribe to RSS Feed
- Permalink
- Report Inappropriate Content
Hi @rack201
Try this code to add a column to your table:
Cumulative Revenue =
VAR _Date =
    FIRSTNONBLANK ( 'Table'[WeekEndingDate], "" )
RETURN
    CALCULATE (
        SUM ( 'Table'[Revenue] ),
        FILTER (
            ALLEXCEPT ( 'Table', 'Table'[Store] ),
            'Table'[WeekEndingDate] <= _Date
        )
    )
Output :
If this post helps, please consider accepting it as the solution to help the other members find it more quickly.
Appreciate your Kudos ✌️!!
- Mark as New
- Bookmark
- Subscribe
- Mute
- Subscribe to RSS Feed
- Permalink
- Report Inappropriate Content
Brilliant - Thank you VahidDM..
Helpful resources
| User | Count |
|---|---|
| 15 | |
| 8 | |
| 6 | |
| 6 | |
| 5 |
| User | Count |
|---|---|
| 25 | |
| 13 | |
| 12 | |
| 8 | |
| 8 |


