Join us at FabCon Vienna from September 15-18, 2025
The ultimate Fabric, Power BI, SQL, and AI community-led learning event. Save €200 with code FABCOMM.
Get registered- Power BI forums
- Get Help with Power BI
- Desktop
- Service
- Report Server
- Power Query
- Mobile Apps
- Developer
- DAX Commands and Tips
- Custom Visuals Development Discussion
- Health and Life Sciences
- Power BI Spanish forums
- Translated Spanish Desktop
- Training and Consulting
- Instructor Led Training
- Dashboard in a Day for Women, by Women
- Galleries
- Data Stories Gallery
- Themes Gallery
- Contests Gallery
- Quick Measures Gallery
- Notebook Gallery
- Translytical Task Flow Gallery
- TMDL Gallery
- R Script Showcase
- Webinars and Video Gallery
- Ideas
- Custom Visuals Ideas (read-only)
- Issues
- Issues
- Events
- Upcoming Events
Enhance your career with this limited time 50% discount on Fabric and Power BI exams. Ends August 31st. Request your voucher.
- Power BI forums
- Forums
- Get Help with Power BI
- DAX Commands and Tips
- Create list of years between two dates in new tabl...
- Subscribe to RSS Feed
- Mark Topic as New
- Mark Topic as Read
- Float this Topic for Current User
- Bookmark
- Subscribe
- Printer Friendly Page
- Mark as New
- Bookmark
- Subscribe
- Mute
- Subscribe to RSS Feed
- Permalink
- Report Inappropriate Content
Create list of years between two dates in new table
Hi All,
I have created a new table that takes two years and generates a series of values of as many years. Here is the first column:
Years =
VAR MinDate = MIN(Projects[ProjectStartDate])
VAR MaxDate = MAX(Projects[ProjectFinishDate])
VAR ProjectTotalYears = DATEDIFF(MinDate, MaxDate,YEAR)
RETURN
GENERATESERIES(0, ProjectTotalYears, 1)
This results in the first columen "Value"
In the Year column, I would like to populate the years between MinDate and MaxDate. If the earliest date is in 2020 and the latest date is 2026, I would like to create the year column to populate with [2020, 2021, 2022, 2023, 2024, 2025, 2026], based on dates given. I was able to figure it out how to do it with months, but not years.
Any help would be great, thanks! 🙂
Minerva
Solved! Go to Solution.
- Mark as New
- Bookmark
- Subscribe
- Mute
- Subscribe to RSS Feed
- Permalink
- Report Inappropriate Content
Hi @minervag
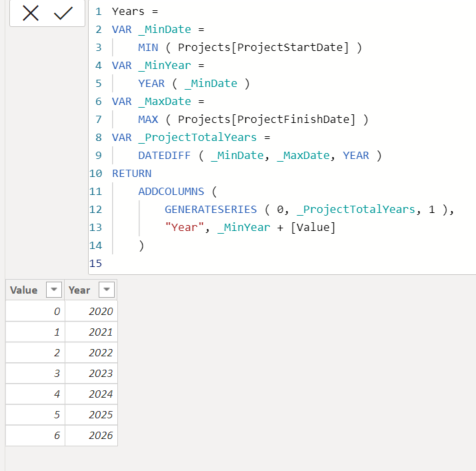
Trt this code:
Years =
VAR _MinDate =
    MIN ( Projects[ProjectStartDate] )
VAR _MinYear =
    YEAR ( _MinDate )
VAR _MaxDate =
    MAX ( Projects[ProjectFinishDate] )
VAR _ProjectTotalYears =
    DATEDIFF ( _MinDate, _MaxDate, YEAR )
RETURN
    ADDCOLUMNS (
        GENERATESERIES ( 0, _ProjectTotalYears, 1 ),
        "Year", _MinYear + [Value]
    )
Output:
If this post helps, please consider accepting it as the solution to help the other members find it more quickly.
Appreciate your Kudos!!
LinkedIn: www.linkedin.com/in/vahid-dm/
- Mark as New
- Bookmark
- Subscribe
- Mute
- Subscribe to RSS Feed
- Permalink
- Report Inappropriate Content
Hi VahidDM,
Thank you for responding! 🙂
I tried this solution and it gave me an error saying, "A table of multiple values was supplied where a single value was expected". I tried changing ADDCOLUMNS to SELECTCOLUMNS like @AlexisOlson suggested, but I got the same error.
Here is the error:
Minerva
- Mark as New
- Bookmark
- Subscribe
- Mute
- Subscribe to RSS Feed
- Permalink
- Report Inappropriate Content
It seems you used that code to add a new column, you need to use that code to add a new TABLE.
If this post helps, please consider accepting it as the solution to help the other members find it more quickly.
Appreciate your Kudos!!
LinkedIn: www.linkedin.com/in/vahid-dm/
- Mark as New
- Bookmark
- Subscribe
- Mute
- Subscribe to RSS Feed
- Permalink
- Report Inappropriate Content
@VahidDM - Never mind! I misunderstood and tried to add it as a seperate column. Once I replied to you, I thought it through and realized that I should try this code as a new table... and it worked!
Thank you, thank you! I appreciate it. 🙂
Success:
- Mark as New
- Bookmark
- Subscribe
- Mute
- Subscribe to RSS Feed
- Permalink
- Report Inappropriate Content
- Mark as New
- Bookmark
- Subscribe
- Mute
- Subscribe to RSS Feed
- Permalink
- Report Inappropriate Content
Helpful resources
| User | Count |
|---|---|
| 11 | |
| 9 | |
| 6 | |
| 6 | |
| 5 |
| User | Count |
|---|---|
| 23 | |
| 14 | |
| 14 | |
| 9 | |
| 7 |


