This time we’re going bigger than ever. Fabric, Power BI, SQL, AI and more. We're covering it all. You won't want to miss it.
Learn moreLevel up your Power BI skills this month - build one visual each week and tell better stories with data! Get started
Hi guys,
I have a problem. I want to create a calculated column call ExpectedOutcome .
The value of column ExpectedOutcome for 1st row where No.Session = 1 is calculated by Score + 90.
From the second row, the value of ExpectedOutcome = previous ExpectedOutcome + Score.
The value of ExpectedOutcome is always in the range of 0 - 100. If it < 0, then we put 0 as the value. If it > 100, then we put 100 as the value.
It seems like calculate a running total, but it is not. And I do not know how to solve this problem.
Plz help me. Thank you.
Solved! Go to Solution.
Hi @Phuonghm22 ,
There is no recursive function in computed columns, you can use Power Query:
Here are the steps you can follow:
1. Power Query – Home -- Advanced Editor.
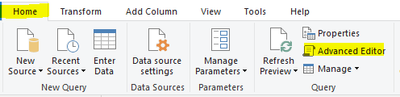
2. Put the following code in it.
let
Source = Table.FromRows(Json.Document(Binary.Decompress(Binary.FromText("Tc/RDcAgCEXRXfjWxIfV2lmM+69REAv9MYeGeO2cBErEtNKU81N1Xa7m6q7bNUS5bT7+EUVYjYgFRAhRQqTQfstRQ+QwgtrLvdgvaDHXM+wmn4H3YNaqXc9aPRtalSev9QI=", BinaryEncoding.Base64), Compression.Deflate)), let _t = ((type nullable text) meta [Serialized.Text = true]) in type table [No.Session = _t, Score = _t]),
test = Table.TransformColumnTypes(Source,{{"No.Session", Int64.Type}, {"Score", Int64.Type}}),
#"Added Custom" = Table.TransformColumns(Table.AddColumn(test, "Custom", (x)=> List.Accumulate(List.Range(test[Score],0,x[No.Session]),0,(x,y)=>if x+y >=10 then 10 else if x+y<=-90 then -90 else x+y) ),{"Custom",(x)=>x+90})
in
#"Added Custom"
3. Result:
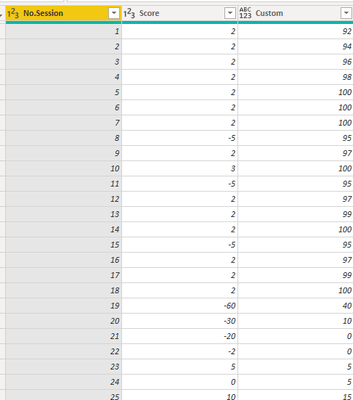
Best Regards,
Liu Yang
If this post helps, then please consider Accept it as the solution to help the other members find it more quickly
Hi @Phuonghm22 ,
There is no recursive function in computed columns, you can use Power Query:
Here are the steps you can follow:
1. Power Query – Home -- Advanced Editor.
2. Put the following code in it.
let
Source = Table.FromRows(Json.Document(Binary.Decompress(Binary.FromText("Tc/RDcAgCEXRXfjWxIfV2lmM+69REAv9MYeGeO2cBErEtNKU81N1Xa7m6q7bNUS5bT7+EUVYjYgFRAhRQqTQfstRQ+QwgtrLvdgvaDHXM+wmn4H3YNaqXc9aPRtalSev9QI=", BinaryEncoding.Base64), Compression.Deflate)), let _t = ((type nullable text) meta [Serialized.Text = true]) in type table [No.Session = _t, Score = _t]),
test = Table.TransformColumnTypes(Source,{{"No.Session", Int64.Type}, {"Score", Int64.Type}}),
#"Added Custom" = Table.TransformColumns(Table.AddColumn(test, "Custom", (x)=> List.Accumulate(List.Range(test[Score],0,x[No.Session]),0,(x,y)=>if x+y >=10 then 10 else if x+y<=-90 then -90 else x+y) ),{"Custom",(x)=>x+90})
in
#"Added Custom"
3. Result:
Best Regards,
Liu Yang
If this post helps, then please consider Accept it as the solution to help the other members find it more quickly
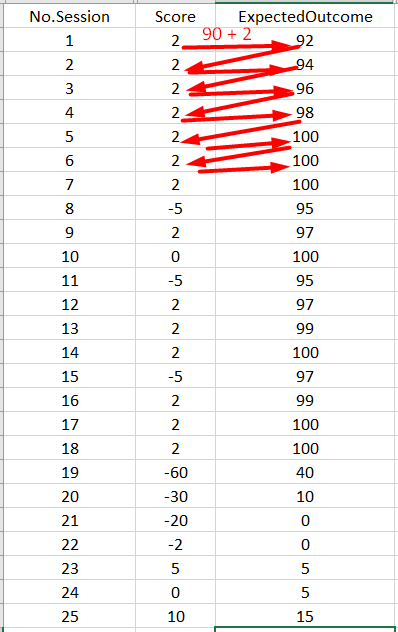
Thank you for reply. But I have another problem that make thing more complicated. The same data sample as I already provided before, but now it have a column that have multiple ID, and I have to use that column ID to group by while calculating. How can I do to handle this problem?
Check out the April 2026 Power BI update to learn about new features.
Sign up to receive a private message when registration opens and key events begin.
If you have recently started exploring Fabric, we'd love to hear how it's going. Your feedback can help with product improvements.
| User | Count |
|---|---|
| 3 | |
| 3 | |
| 3 | |
| 3 | |
| 3 |
| User | Count |
|---|---|
| 8 | |
| 8 | |
| 7 | |
| 6 | |
| 6 |