Party with Power BI’s own Guy in a Cube
Power BI is turning 10! Tune in for a special live episode on July 24 with behind-the-scenes stories, product evolution highlights, and a sneak peek at what’s in store for the future.
Save the date- Power BI forums
- Get Help with Power BI
- Desktop
- Service
- Report Server
- Power Query
- Mobile Apps
- Developer
- DAX Commands and Tips
- Custom Visuals Development Discussion
- Health and Life Sciences
- Power BI Spanish forums
- Translated Spanish Desktop
- Training and Consulting
- Instructor Led Training
- Dashboard in a Day for Women, by Women
- Galleries
- Webinars and Video Gallery
- Data Stories Gallery
- Themes Gallery
- Contests Gallery
- Quick Measures Gallery
- Notebook Gallery
- Translytical Task Flow Gallery
- R Script Showcase
- Ideas
- Custom Visuals Ideas (read-only)
- Issues
- Issues
- Events
- Upcoming Events
Enhance your career with this limited time 50% discount on Fabric and Power BI exams. Ends August 31st. Request your voucher.
- Power BI forums
- Forums
- Get Help with Power BI
- DAX Commands and Tips
- Count Strings and return top 1 from a measure wit...
- Subscribe to RSS Feed
- Mark Topic as New
- Mark Topic as Read
- Float this Topic for Current User
- Bookmark
- Subscribe
- Printer Friendly Page
- Mark as New
- Bookmark
- Subscribe
- Mute
- Subscribe to RSS Feed
- Permalink
- Report Inappropriate Content
Count Strings and return top 1 from a measure with Switch()
Hi all
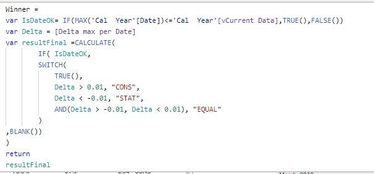
I have a problem with calculating max occurence of a string from measure Winner
there are 3 option : CONS STAT and EQUAL, based on Delta measure
Is it possible to return a winer over entire period ? (top 1 of occurences from Winner measure)
Solved! Go to Solution.
- Mark as New
- Bookmark
- Subscribe
- Mute
- Subscribe to RSS Feed
- Permalink
- Report Inappropriate Content
Hi @Anonymous ,
Based on your description, I have created a simple sample:
Please try:
Measure =
VAR _a =
    ADDCOLUMNS ( 'Cal Year', "Winner", [Winner] )
VAR _b =
    ADDCOLUMNS (
        { "CONS", "EQUAL", "STAT" },
        "Count", COUNTX ( FILTER ( _a, [Winner] = EARLIER ( [Value] ) ), [Winner] )
    )
VAR _c =
    MAXX ( _b, [Count] )
VAR _d =
    MAXX ( FILTER ( _b, [Count] = _c ), [Value] )
RETURN
    "Winner: " & _d & "  Count: " & _c
Final output:
Best Regards,
Jianbo Li
If this post helps, then please consider Accept it as the solution to help the other members find it more quickly.
- Mark as New
- Bookmark
- Subscribe
- Mute
- Subscribe to RSS Feed
- Permalink
- Report Inappropriate Content
Hi @Anonymous ,
Maybe you can use SUMMARIZE() function, it returns a summary table for the requested totals over a set of groups.
For more details, please refer to:
SUMMARIZE function (DAX) - DAX | Microsoft Learn
Best Regards,
Jianbo Li
If this post helps, then please consider Accept it as the solution to help the other members find it more quickly.
- Mark as New
- Bookmark
- Subscribe
- Mute
- Subscribe to RSS Feed
- Permalink
- Report Inappropriate Content
Hi @Anonymous ,
Based on your description, I have created a simple sample:
Please try:
Measure =
VAR _a =
    ADDCOLUMNS ( 'Cal Year', "Winner", [Winner] )
VAR _b =
    ADDCOLUMNS (
        { "CONS", "EQUAL", "STAT" },
        "Count", COUNTX ( FILTER ( _a, [Winner] = EARLIER ( [Value] ) ), [Winner] )
    )
VAR _c =
    MAXX ( _b, [Count] )
VAR _d =
    MAXX ( FILTER ( _b, [Count] = _c ), [Value] )
RETURN
    "Winner: " & _d & "  Count: " & _c
Final output:
Best Regards,
Jianbo Li
If this post helps, then please consider Accept it as the solution to help the other members find it more quickly.
- Mark as New
- Bookmark
- Subscribe
- Mute
- Subscribe to RSS Feed
- Permalink
- Report Inappropriate Content
Thank you!! works perfectly:)
would it be possible to pass dynamic table into _b variable? instead of {"CONS","STAT","EQUAL"} having a distinct values from "Winner" column from _a variable?
- Mark as New
- Bookmark
- Subscribe
- Mute
- Subscribe to RSS Feed
- Permalink
- Report Inappropriate Content
@Anonymous , If winner is a measure, first you have to do dynamic segmentation and then try for TOPN of rank
Customer Retention with Dynamic Segmentation, New/Lost/Retain Customer Count: https://www.youtube.com/watch?v=W4EF1f_k6iY
- Mark as New
- Bookmark
- Subscribe
- Mute
- Subscribe to RSS Feed
- Permalink
- Report Inappropriate Content
Hi, thanks for reply,
I had made dynamic segmentation and it works but only if i sum winner over a calendar,
when i want to count winner over a product it seems im missing a relation in a measure
My current segment:
Measure
and the output
now i need to make matrix table with my products in rows and Scenario (cons, stat,equal) as columns
this seems like im missing the relation between my measure and the material table. I've tried to change a measure by replacing countrows(cal year) with countrows(fact_table - which has material column) but the query is too big to calculate. Same issue when i use virtual table...is there a simple way to calculate the segment over date by each material?
Helpful resources

Power BI Monthly Update - July 2025
Check out the July 2025 Power BI update to learn about new features.

| User | Count |
|---|---|
| 22 | |
| 7 | |
| 6 | |
| 6 | |
| 6 |
| User | Count |
|---|---|
| 27 | |
| 12 | |
| 10 | |
| 9 | |
| 6 |


