FabCon is coming to Atlanta
Join us at FabCon Atlanta from March 16 - 20, 2026, for the ultimate Fabric, Power BI, AI and SQL community-led event. Save $200 with code FABCOMM.
Register now!- Power BI forums
- Get Help with Power BI
- Desktop
- Service
- Report Server
- Power Query
- Mobile Apps
- Developer
- DAX Commands and Tips
- Custom Visuals Development Discussion
- Health and Life Sciences
- Power BI Spanish forums
- Translated Spanish Desktop
- Training and Consulting
- Instructor Led Training
- Dashboard in a Day for Women, by Women
- Galleries
- Data Stories Gallery
- Themes Gallery
- Contests Gallery
- QuickViz Gallery
- Quick Measures Gallery
- Visual Calculations Gallery
- Notebook Gallery
- Translytical Task Flow Gallery
- TMDL Gallery
- R Script Showcase
- Webinars and Video Gallery
- Ideas
- Custom Visuals Ideas (read-only)
- Issues
- Issues
- Events
- Upcoming Events
The Power BI Data Visualization World Championships is back! It's time to submit your entry. Live now!
- Power BI forums
- Forums
- Get Help with Power BI
- DAX Commands and Tips
- Re: Conditional Formatting with Calculation Groups...
- Subscribe to RSS Feed
- Mark Topic as New
- Mark Topic as Read
- Float this Topic for Current User
- Bookmark
- Subscribe
- Printer Friendly Page
- Mark as New
- Bookmark
- Subscribe
- Mute
- Subscribe to RSS Feed
- Permalink
- Report Inappropriate Content
Conditional Formatting with Calculation Groups - Issues, please help me
Hi community, I developed a model with some conditional formatting, and I'm quite happy with it.
Since the number of measures is quickly growing, I've started to implement Calculation Groups, to make it more efficient, and the model actually works fine with calculation groups implemented. Despite that, I found some issues with a simple conditional formatting configuration.
Download - Sample Model (300 kb):
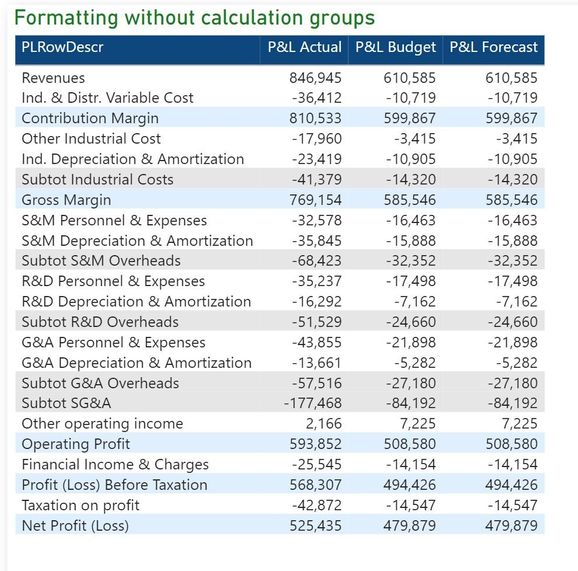
My basic conditional formatted visual without calculation groups looks as follows, and works just fine.
The formatting condition is pretty simple and based on one field.
The background of the rows of the table 'PL_Structure' is light blue where the field 'PL_Structure' [PL_Detail] has value 0 (running total rows), while are colored in light grey where the field value is 2 (subtotal row). The other - common rows - stay white (default color).
The structure of the table can be found in the attachment together with the model (DataSource.xlsx), and includes an explanation of key fields as well.
My formatting conditions
The "PL SubTot Color" measure simply reads the SELECTEDVALUE of the above mentioned [PL_Detail] field):
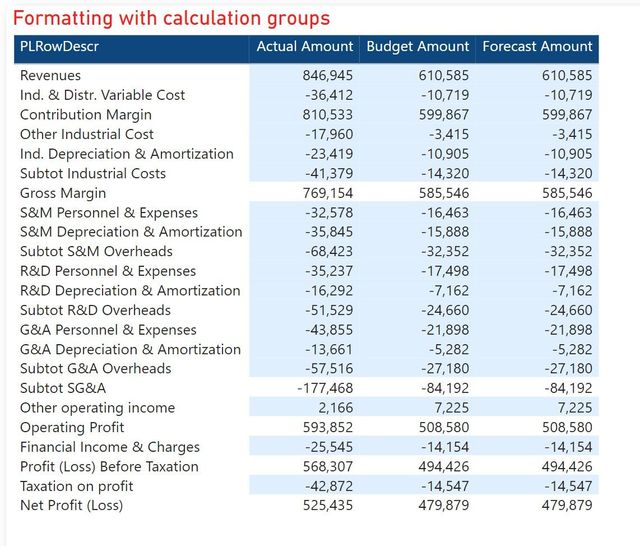
Now, with calculation groups implemented, I'm experimenting a strange behaviour, the numbers are just ok, but the table looks as follows:
Maybe I did not fully understand the logics behind calculation groups, but I find them extremely useful for maintenance purposes.
The attached model includes a side by side (with / without calculation groups).
I do appreciate any suggestion or fix. Thank you.
Marco
Solved! Go to Solution.
- Mark as New
- Bookmark
- Subscribe
- Mute
- Subscribe to RSS Feed
- Permalink
- Report Inappropriate Content
I found the solution by myself. If somebody is interested, let me know, to post it.
Thanks anyway to all.
Marco
- Mark as New
- Bookmark
- Subscribe
- Mute
- Subscribe to RSS Feed
- Permalink
- Report Inappropriate Content
hi @marcofalzone -
I am also looking for a similar solution where I can do formatting for particular groups at row level in a matrix using calculation groups.
It would be great if you can post the solution or links that can help
- Mark as New
- Bookmark
- Subscribe
- Mute
- Subscribe to RSS Feed
- Permalink
- Report Inappropriate Content
Sure, let me know if you prefer to send me a sample of your dataset (real case), or as alternative, I can give a generic example based on my experience.
- Mark as New
- Bookmark
- Subscribe
- Mute
- Subscribe to RSS Feed
- Permalink
- Report Inappropriate Content
@marcofalzone - Thanks for the quick response!
I have calculation group with two items Sales and Quantity.
I would like to apply background color only on Sales column and for the Category - Bikes
Sample File
- Mark as New
- Bookmark
- Subscribe
- Mute
- Subscribe to RSS Feed
- Permalink
- Report Inappropriate Content
Hello @shinym201290 ,
thanks for the opportunity to help and give something back to this great community.
I downloaded your sample model and found that in this specific case you maybe don't need to involve calculation groups at all, for the category selection.
In the proposed solution attached you can find a smoother alternative that allow you to color one (or more) specific categories (like bikes) using a combination of one simple detached table and one selection measure. Plus, a simple and convenient conditional formatting measure.
Please, let me know if this solution fit your needs, and thanks again for enquiring me, I'm pleased to help.
In the attachment you can also find an "Information" tab with indications shown in this message.
Download link:
https://www.dropbox.com/scl/fi/72nlwuacmja7k8ohibli4/Calculation-groups-bg-formatting-V2.pbix?rlkey=...
PD: If you're still interested in conditional formatting with calculation groups, I can share the solution I currently use with tables visuals and matrix visuals in my models.
Marco Falzone - Monterrey, Mexico
- Mark as New
- Bookmark
- Subscribe
- Mute
- Subscribe to RSS Feed
- Permalink
- Report Inappropriate Content
@marcofalzone - Thanks for the detailed explanation and solution.
It was my bad that I did not illustrate clearly why we wanted to go with calculation group for a basic use case.
Please find the sample report with the use case and why we decided to go with calculation groups.
If you think its time consuming to go through the use case. It would be great if you can provide the solution for conditional formatting with calculation groups if you have one already!
Thank you for your time!
- Mark as New
- Bookmark
- Subscribe
- Mute
- Subscribe to RSS Feed
- Permalink
- Report Inappropriate Content
I found the solution by myself. If somebody is interested, let me know, to post it.
Thanks anyway to all.
Marco
- Mark as New
- Bookmark
- Subscribe
- Mute
- Subscribe to RSS Feed
- Permalink
- Report Inappropriate Content
Can you please share? I have same problem. Thanks
Helpful resources

Power BI Dataviz World Championships
The Power BI Data Visualization World Championships is back! It's time to submit your entry.

Power BI Monthly Update - January 2026
Check out the January 2026 Power BI update to learn about new features.

| User | Count |
|---|---|
| 9 | |
| 7 | |
| 4 | |
| 4 | |
| 4 |
| User | Count |
|---|---|
| 19 | |
| 17 | |
| 12 | |
| 10 | |
| 6 |


