FabCon is coming to Atlanta
Join us at FabCon Atlanta from March 16 - 20, 2026, for the ultimate Fabric, Power BI, AI and SQL community-led event. Save $200 with code FABCOMM.
Register now!- Power BI forums
- Get Help with Power BI
- Desktop
- Service
- Report Server
- Power Query
- Mobile Apps
- Developer
- DAX Commands and Tips
- Custom Visuals Development Discussion
- Health and Life Sciences
- Power BI Spanish forums
- Translated Spanish Desktop
- Training and Consulting
- Instructor Led Training
- Dashboard in a Day for Women, by Women
- Galleries
- Data Stories Gallery
- Themes Gallery
- Contests Gallery
- QuickViz Gallery
- Quick Measures Gallery
- Visual Calculations Gallery
- Notebook Gallery
- Translytical Task Flow Gallery
- TMDL Gallery
- R Script Showcase
- Webinars and Video Gallery
- Ideas
- Custom Visuals Ideas (read-only)
- Issues
- Issues
- Events
- Upcoming Events
The Power BI Data Visualization World Championships is back! Get ahead of the game and start preparing now! Learn more
- Power BI forums
- Forums
- Get Help with Power BI
- DAX Commands and Tips
- Re: Changing Data through slicer
- Subscribe to RSS Feed
- Mark Topic as New
- Mark Topic as Read
- Float this Topic for Current User
- Bookmark
- Subscribe
- Printer Friendly Page
- Mark as New
- Bookmark
- Subscribe
- Mute
- Subscribe to RSS Feed
- Permalink
- Report Inappropriate Content
Changing Data through slicer
I would like to create new data based on a slicer setting i have chosen linked to a parameter values. For example, i have a baseline monthly forecast for 2022. I would like to apply a percentage change to this baseline forecast for alternative scenarios. For instance, i want to see what the forecast looks like if it was 5% higher than the baseline forecast. I need this at the data column level and not a measure so that i can create some formulas off that new column data. For instance, if column B is the baseline forecast, I have create a new column that equals the baseline forecast column multiplied by (1+ parameter value); in this case, i set my slicer to 5%. I could have easily chosen 6% or something else, that's the type of functionality I'd like to build.
I have created a measure that works visually for this, but i realized I really need this at the column level to use it for other things the way I want.

- Mark as New
- Bookmark
- Subscribe
- Mute
- Subscribe to RSS Feed
- Permalink
- Report Inappropriate Content
Is it possible to create a new data table in Power BI using this measure you just created so i can get it at a base level using the summarizecolumn function? = SUMMARIZECOLUMNS('Sheet1'[Date],"Original Hours",average('sheet1'[Baseline Forecast]),"Adj Hours", 'sheet'[Adjusted Forecast])
I need to get the adjusted forecast at a base level so can plug this adjusted forecast number (hours) into a formula that calculates a new sales forecast by date that i can sum all the date sales forecasts into a monthly, quarterly, or annual sales forecast. If I end up not getting the adjusted hours forecast at the base date level, the measure is either summing or averaging all dates' hours which will not work for my formula. I need the sales formula to calculate an answer for each date that i can later sum, not come up with an answer right away because i don't what the measure you created ends up giving me.
- Mark as New
- Bookmark
- Subscribe
- Mute
- Subscribe to RSS Feed
- Permalink
- Report Inappropriate Content
I'm sorry this is not a solution that works for what I am doing. This could work if it generated a new table with base data that changes when we adjust the slicer settings. I need to build a formula at the base level that i can then sum all the individual period solutions into a total. When i use a measure it either sums or averages the solulutions for all periods for the formula which gives a incorrect answer.
- Mark as New
- Bookmark
- Subscribe
- Mute
- Subscribe to RSS Feed
- Permalink
- Report Inappropriate Content
Hi @dmartiprev ,
Here are the steps you can follow:
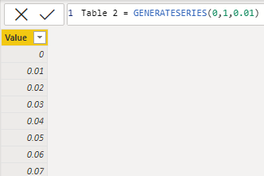
1. Create calculated table.
Table 2 = GENERATESERIES(0,1,0.01)2. Create measure.
Adjusted Forecast =
var _select=SELECTEDVALUE('Table 2'[Value])
var _sum=SUMX('Table','Table'[Baseline Forcast])
return
 _sum*( 1+_select)
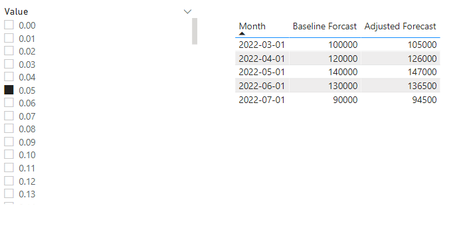
3. Result:
Take [Value] as the slicer.
Best Regards,
Liu Yang
If this post helps, then please consider Accept it as the solution to help the other members find it more quickly
- Mark as New
- Bookmark
- Subscribe
- Mute
- Subscribe to RSS Feed
- Permalink
- Report Inappropriate Content
@dmartiprev , You can not use slicer value in a new column, you have to create a measure using sumx to have line-level values
Adjusted Forecast =Sumx( 'sheet1', 'sheet1'[Baseline Forecast]*(1+[Adjustment Parameter Value Measure]/100) )
assuming Adjustment Parameter is what if parameter - https://docs.microsoft.com/en-us/power-bi/desktop-what-if
Helpful resources

Power BI Dataviz World Championships
The Power BI Data Visualization World Championships is back! Get ahead of the game and start preparing now!

| User | Count |
|---|---|
| 19 | |
| 13 | |
| 8 | |
| 4 | |
| 4 |
| User | Count |
|---|---|
| 29 | |
| 24 | |
| 17 | |
| 11 | |
| 10 |


