Fabric Data Days starts November 4th!
Advance your Data & AI career with 50 days of live learning, dataviz contests, hands-on challenges, study groups & certifications and more!
Get registered- Power BI forums
- Get Help with Power BI
- Desktop
- Service
- Report Server
- Power Query
- Mobile Apps
- Developer
- DAX Commands and Tips
- Custom Visuals Development Discussion
- Health and Life Sciences
- Power BI Spanish forums
- Translated Spanish Desktop
- Training and Consulting
- Instructor Led Training
- Dashboard in a Day for Women, by Women
- Galleries
- Data Stories Gallery
- Themes Gallery
- Contests Gallery
- Quick Measures Gallery
- Visual Calculations Gallery
- Notebook Gallery
- Translytical Task Flow Gallery
- TMDL Gallery
- R Script Showcase
- Webinars and Video Gallery
- Ideas
- Custom Visuals Ideas (read-only)
- Issues
- Issues
- Events
- Upcoming Events
Join us at FabCon Atlanta from March 16 - 20, 2026, for the ultimate Fabric, Power BI, AI and SQL community-led event. Save $200 with code FABCOMM. Register now.
- Power BI forums
- Forums
- Get Help with Power BI
- DAX Commands and Tips
- Calculating Changes between user defined periods
- Subscribe to RSS Feed
- Mark Topic as New
- Mark Topic as Read
- Float this Topic for Current User
- Bookmark
- Subscribe
- Printer Friendly Page
- Mark as New
- Bookmark
- Subscribe
- Mute
- Subscribe to RSS Feed
- Permalink
- Report Inappropriate Content
Calculating Changes between user defined periods
I need to create the rate of change between the periods in a slicer, below is an example visual.
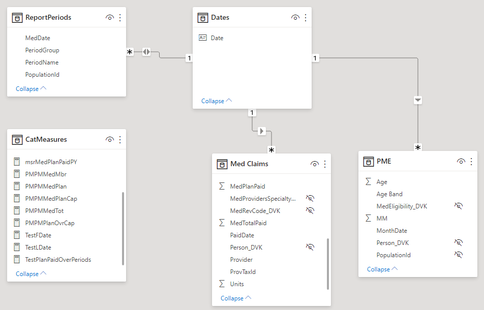
You can see that the user has selected a range of report periods, and the dates in the grid are for illistrative purposes so you can see that we are not necessarily working with calendar years, but user selected/defined reports periods that are in a table related to the "Date" table which relates to the claims values, see model below.

Note that PMPMMedPlan is itself a measure that is calculated as "PMPMMedPlan = Sum('Med Claims'[MedPlanPaid]) / Sum(PME[MM])"
Considering
Plan Paid PMPM Rate Changes | ||
Year | PMPM | Yr to Yr |
2016f | $287.74 | |
2017f | $311.32 | 7.5% |
2018f | $348.03 | 10.5% |
2019f | $345.07 | -0.9% |
2020f | $342.47 | -0.4% |
I need to calculate "Yr to Yr" which is the difference between periods) / value for current period i.e.
For 2020f ((342.47 - 345.07) / 342.47) = -1.2 / 342.47 = -0.0035039565509388, to be expressed as % = -0.4%
- Mark as New
- Bookmark
- Subscribe
- Mute
- Subscribe to RSS Feed
- Permalink
- Report Inappropriate Content
@spartan27244 , usually in such cases when do have standard period we use rank on period
New column in date table
new column
Period Rank = RANKX(all('Period'),'Period'[year period],,ASC,Dense)
measure
This Period = CALCULATE(sum('order'[Qty]), FILTER(ALL('Period'),'Period'[Period Rank]=max('Period'[Period Rank])))
Last Period = CALCULATE(sum('order'[Qty]), FILTER(ALL('Period'),'Period'[Period Rank]=max('Period'[Period Rank])-1))
Last year same period= CALCULATE(sum('order'[Qty]), FILTER(ALL('Date'),'Date'[Year]=max('Date'[Year])-1 && 'Date'[Month] = Max('Date'[Month])))
or
Last Year Period = CALCULATE(sum('order'[Qty]), FILTER(ALL('Period'),'Period'[Period]=max('Period'[Period]) && 'Period'[Year]=max('Period'[Year])-1))
new column
Year Rank = RANKX(all('Date'),'Date'[Year Start date],,ASC,Dense)
new measures
This Year = CALCULATE(sum('order'[Qty]), FILTER(ALL('Date'),'Date'[Year Rank]=max('Date'[Year Rank])))
Last Year = CALCULATE(sum('order'[Qty]), FILTER(ALL('Date'),'Date'[Year Rank]=max('Date'[Year Rank])-1))
- Mark as New
- Bookmark
- Subscribe
- Mute
- Subscribe to RSS Feed
- Permalink
- Report Inappropriate Content
These are not standard Calendar year periods as indicated in the dates shown for illustrative purposes. In addition the ReportPeriod table is a customer populationId, a Group Name (Calendar Year, Fiscal Year, Benefit Year, Custom), a period name 2015, 2016, 2017, etc. and a date field MedDate. There is a MedDate for every day within the period so that it redily joins with the model's DATE table.
Helpful resources
| User | Count |
|---|---|
| 12 | |
| 9 | |
| 8 | |
| 8 | |
| 7 |


