FabCon is coming to Atlanta
Join us at FabCon Atlanta from March 16 - 20, 2026, for the ultimate Fabric, Power BI, AI and SQL community-led event. Save $200 with code FABCOMM.
Register now!- Power BI forums
- Get Help with Power BI
- Desktop
- Service
- Report Server
- Power Query
- Mobile Apps
- Developer
- DAX Commands and Tips
- Custom Visuals Development Discussion
- Health and Life Sciences
- Power BI Spanish forums
- Translated Spanish Desktop
- Training and Consulting
- Instructor Led Training
- Dashboard in a Day for Women, by Women
- Galleries
- Data Stories Gallery
- Themes Gallery
- Contests Gallery
- Quick Measures Gallery
- Notebook Gallery
- Translytical Task Flow Gallery
- TMDL Gallery
- R Script Showcase
- Webinars and Video Gallery
- Ideas
- Custom Visuals Ideas (read-only)
- Issues
- Issues
- Events
- Upcoming Events
To celebrate FabCon Vienna, we are offering 50% off select exams. Ends October 3rd. Request your discount now.
- Power BI forums
- Forums
- Get Help with Power BI
- DAX Commands and Tips
- Re: Calculate only if value is there for all selec...
- Subscribe to RSS Feed
- Mark Topic as New
- Mark Topic as Read
- Float this Topic for Current User
- Bookmark
- Subscribe
- Printer Friendly Page
- Mark as New
- Bookmark
- Subscribe
- Mute
- Subscribe to RSS Feed
- Permalink
- Report Inappropriate Content
Calculate only if value is there for all selected years
Hello Community,
I have a multi-year fees data set for different countries. Year field is used in the slicer, so when the user selects multiple years then the calculation should display only the sum of fess that are for the countries that have all the selected years.
For example: In the below dataset, when the years "2020 and 2021" are selected, then sum of fees should be calculated only for the countries that have "Fees" for the years "2020 and 2021".
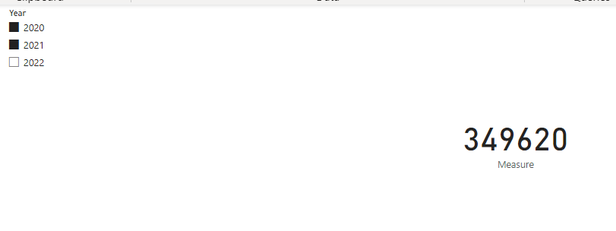
i.e. Countries that have fees for both 2020 and 2021 are Argentina, India, and China, so sum of fees = 349620
| ID | Country | Entity | Year | Fees |
| 1 | India | A | 2020 | 21883 |
| 2 | Argentina | B | 2020 | 87936 |
| 3 | China | C | 2020 | 67194 |
| 4 | India | A | 2021 | 30482 |
| 5 | Brazil | D | 2021 | 4435 |
| 6 | Argentina | B | 2021 | 72670 |
| 7 | China | C | 2021 | 69455 |
| 8 | India | A | 2022 | 6470 |
| 9 | Brazil | D | 2022 | 48177 |
| 10 | China | C | 2022 | 5338 |
Please can someone help me how to achieve this in power bi?
Solved! Go to Solution.
- Mark as New
- Bookmark
- Subscribe
- Mute
- Subscribe to RSS Feed
- Permalink
- Report Inappropriate Content
| Thanks to the great efforts by MS engineers to simplify syntax of DAX! Most beginners are SUCCESSFULLY MISLED to think that they could easily master DAX; but it turns out that the intricacy of the most frequently used RANKX() is still way beyond their comprehension! |
DAX is simple, but NOT EASY! |
- Mark as New
- Bookmark
- Subscribe
- Mute
- Subscribe to RSS Feed
- Permalink
- Report Inappropriate Content
Hi @AnthonyJoseph ,
Here are the steps you can follow:
1. Create measure.
Measure =
var _select1=MINX(ALLSELECTED('Table'),[Year])
var _select2=MaxX(ALLSELECTED('Table'),[Year])
var _table1=
FILTER(ALL('Table'),'Table'[Year]in {_select1,_select2})
var _table2=
ADDCOLUMNS(_table1,"count",COUNTX(FILTER(_table1,[Country]=EARLIER('Table'[Country])),[Country]))
return
SUMX(FILTER( _table2,[count]>=2),[Fees])
2. Result:
If you need pbix, please click here.
Best Regards,
Liu Yang
If this post helps, then please consider Accept it as the solution to help the other members find it more quickly
- Mark as New
- Bookmark
- Subscribe
- Mute
- Subscribe to RSS Feed
- Permalink
- Report Inappropriate Content
| Thanks to the great efforts by MS engineers to simplify syntax of DAX! Most beginners are SUCCESSFULLY MISLED to think that they could easily master DAX; but it turns out that the intricacy of the most frequently used RANKX() is still way beyond their comprehension! |
DAX is simple, but NOT EASY! |
- Mark as New
- Bookmark
- Subscribe
- Mute
- Subscribe to RSS Feed
- Permalink
- Report Inappropriate Content
Total Fees =
var SelectedYears = ALLSELECTED( T[Year] )
var CountriesWithFeesInAllSelectedYears =
    filter(
        distinct( T[Country] ),
        calculate(
            isempty(
                except(
                    SelectedYears,
                    distinct( T[Year] )
                )
            )
        )
    )
var Result =
    calculate(
        sum( T[Fees] ),
        CountriesWithFeesInAllSelectedYears
    )
return
    Result
- Mark as New
- Bookmark
- Subscribe
- Mute
- Subscribe to RSS Feed
- Permalink
- Report Inappropriate Content
Hi @AnthonyJoseph
Here is a sample file with the solution https://www.dropbox.com/t/B7QvosI10ak7l6hg
Create a filter table as follows
The create a filter measure, place in the filter pane of the visual, select "Is not blank" and apply the filter
Filter Measure =
VAR SelectedYears = VALUES ( 'Year'[Year] )
VAR SelectedCountries =
    CALCULATETABLE (
        VALUES ( Data[Year] ),
        TREATAS ( SelectedYears, Data[Year] ),
        ALLEXCEPT ( Data, Data[Country] )
    )
RETURN
    IF (
        COUNTROWS ( SelectedCountries )
            = COUNTROWS ( SelectedYears ),
        1
    )
Other method using EXCEPT function as follows
Filter Measure 2 =
VAR SelectedYears = VALUES ( 'Year'[Year] )
VAR SelectedCountries =
    CALCULATETABLE (
        VALUES ( Data[Year] ),
        TREATAS ( SelectedYears, Data[Year] ),
        ALLEXCEPT ( Data, Data[Country] )
    )
RETURN
    COUNTROWS (
        EXCEPT ( SelectedYears, SelectedCountries )
    )


