FabCon is coming to Atlanta
Join us at FabCon Atlanta from March 16 - 20, 2026, for the ultimate Fabric, Power BI, AI and SQL community-led event. Save $200 with code FABCOMM.
Register now!- Power BI forums
- Get Help with Power BI
- Desktop
- Service
- Report Server
- Power Query
- Mobile Apps
- Developer
- DAX Commands and Tips
- Custom Visuals Development Discussion
- Health and Life Sciences
- Power BI Spanish forums
- Translated Spanish Desktop
- Training and Consulting
- Instructor Led Training
- Dashboard in a Day for Women, by Women
- Galleries
- Data Stories Gallery
- Themes Gallery
- Contests Gallery
- QuickViz Gallery
- Quick Measures Gallery
- Visual Calculations Gallery
- Notebook Gallery
- Translytical Task Flow Gallery
- TMDL Gallery
- R Script Showcase
- Webinars and Video Gallery
- Ideas
- Custom Visuals Ideas (read-only)
- Issues
- Issues
- Events
- Upcoming Events
The Power BI Data Visualization World Championships is back! Get ahead of the game and start preparing now! Learn more
- Power BI forums
- Forums
- Get Help with Power BI
- DAX Commands and Tips
- Calculate date base on date row and create duplica...
- Subscribe to RSS Feed
- Mark Topic as New
- Mark Topic as Read
- Float this Topic for Current User
- Bookmark
- Subscribe
- Printer Friendly Page
- Mark as New
- Bookmark
- Subscribe
- Mute
- Subscribe to RSS Feed
- Permalink
- Report Inappropriate Content
Calculate date base on date row and create duplicates
Hi guys
I want to create duplicate row which show duration of a event.
For example, "SetupsStart"=1/26 "AgentsAll In" =1/30
I want to create extra rows which cover the period which the result will come out as
| SetupsStart | 1/26/2024 |
| SetupsStart | 1/27/2024 |
| SetupsStart | 1/28/2024 |
| SetupsStart | 1/29/2024 |
| AgentsAll In | 1/30/2024 |
Is there anyway to achieve this ?
Thanks in advances!!!
Solved! Go to Solution.
- Mark as New
- Bookmark
- Subscribe
- Mute
- Subscribe to RSS Feed
- Permalink
- Report Inappropriate Content
Hi @njxfoster
I have provided a way to solve your problem:
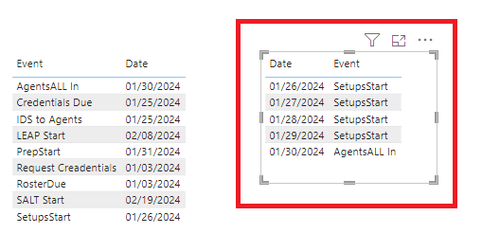
Here's some dummy data
"Table"
You can create a new date table with the time range "01/26/2024" to "01/30/2024".
Date = CALENDAR("1/26/2024", "1/30/2024")
Create a measure. Determine the date range and fill in the value.
Event =
var start_date =
    CALCULATE(
        MAX('Table'[Date]),
        FILTER(
            ALL('Table'),
            'Table'[Event] = "SetupsStart"
        )
    )
var end_date =
    CALCULATE(
        MIN('Table'[Date]),
        FILTER(
            ALL('Table'),
            'Table'[Event] = "AgentsALL In"
        )
    )
RETURN
    IF(
        SELECTEDVALUE('Date'[Date]) >= start_date
        &&
        SELECTEDVALUE('Date'[Date]) <> end_date,
        "SetupsStart",
        "AgentsALL In"
    )
Here is the result.
Regards,
Nono Chen
If this post helps, then please consider Accept it as the solution to help the other members find it more quickly.
- Mark as New
- Bookmark
- Subscribe
- Mute
- Subscribe to RSS Feed
- Permalink
- Report Inappropriate Content
Hi Thank you for your reply! I need a solution that can cover all these event. The solution you provided only cover "SetupStart"and "AgentsAll in". Is there a solution that can cover all the other events (eg LeapStat, PrepStart etc) as well as other events that get added in the future?
- Mark as New
- Bookmark
- Subscribe
- Mute
- Subscribe to RSS Feed
- Permalink
- Report Inappropriate Content
Once you have that, what will be your next step? Some sort of count of days per event?
Helpful resources

Power BI Dataviz World Championships
The Power BI Data Visualization World Championships is back! Get ahead of the game and start preparing now!

| User | Count |
|---|---|
| 19 | |
| 13 | |
| 8 | |
| 4 | |
| 4 |
| User | Count |
|---|---|
| 29 | |
| 24 | |
| 17 | |
| 11 | |
| 10 |


