Party with Power BI’s own Guy in a Cube
Power BI is turning 10! Tune in for a special live episode on July 24 with behind-the-scenes stories, product evolution highlights, and a sneak peek at what’s in store for the future.
Save the date- Power BI forums
- Get Help with Power BI
- Desktop
- Service
- Report Server
- Power Query
- Mobile Apps
- Developer
- DAX Commands and Tips
- Custom Visuals Development Discussion
- Health and Life Sciences
- Power BI Spanish forums
- Translated Spanish Desktop
- Training and Consulting
- Instructor Led Training
- Dashboard in a Day for Women, by Women
- Galleries
- Data Stories Gallery
- Themes Gallery
- Contests Gallery
- Quick Measures Gallery
- Notebook Gallery
- Translytical Task Flow Gallery
- TMDL Gallery
- R Script Showcase
- Webinars and Video Gallery
- Ideas
- Custom Visuals Ideas (read-only)
- Issues
- Issues
- Events
- Upcoming Events
Enhance your career with this limited time 50% discount on Fabric and Power BI exams. Ends August 31st. Request your voucher.
- Power BI forums
- Forums
- Get Help with Power BI
- DAX Commands and Tips
- Calculate date base on date row and create duplica...
- Subscribe to RSS Feed
- Mark Topic as New
- Mark Topic as Read
- Float this Topic for Current User
- Bookmark
- Subscribe
- Printer Friendly Page
- Mark as New
- Bookmark
- Subscribe
- Mute
- Subscribe to RSS Feed
- Permalink
- Report Inappropriate Content
Calculate date base on date row and create duplicates
Hi guys
I want to create duplicate row which show duration of a event.
For example, "SetupsStart"=1/26 "AgentsAll In" =1/30
I want to create extra rows which cover the period which the result will come out as
| SetupsStart | 1/26/2024 |
| SetupsStart | 1/27/2024 |
| SetupsStart | 1/28/2024 |
| SetupsStart | 1/29/2024 |
| AgentsAll In | 1/30/2024 |
Is there anyway to achieve this ?
Thanks in advances!!!
Solved! Go to Solution.
- Mark as New
- Bookmark
- Subscribe
- Mute
- Subscribe to RSS Feed
- Permalink
- Report Inappropriate Content
Hi @njxfoster
I have provided a way to solve your problem:
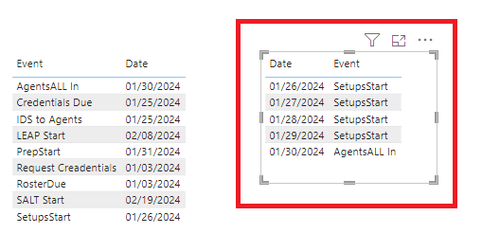
Here's some dummy data
"Table"
You can create a new date table with the time range "01/26/2024" to "01/30/2024".
Date = CALENDAR("1/26/2024", "1/30/2024")
Create a measure. Determine the date range and fill in the value.
Event =
var start_date =
    CALCULATE(
        MAX('Table'[Date]),
        FILTER(
            ALL('Table'),
            'Table'[Event] = "SetupsStart"
        )
    )
var end_date =
    CALCULATE(
        MIN('Table'[Date]),
        FILTER(
            ALL('Table'),
            'Table'[Event] = "AgentsALL In"
        )
    )
RETURN
    IF(
        SELECTEDVALUE('Date'[Date]) >= start_date
        &&
        SELECTEDVALUE('Date'[Date]) <> end_date,
        "SetupsStart",
        "AgentsALL In"
    )
Here is the result.
Regards,
Nono Chen
If this post helps, then please consider Accept it as the solution to help the other members find it more quickly.
- Mark as New
- Bookmark
- Subscribe
- Mute
- Subscribe to RSS Feed
- Permalink
- Report Inappropriate Content
Hi Thank you for your reply! I need a solution that can cover all these event. The solution you provided only cover "SetupStart"and "AgentsAll in". Is there a solution that can cover all the other events (eg LeapStat, PrepStart etc) as well as other events that get added in the future?
- Mark as New
- Bookmark
- Subscribe
- Mute
- Subscribe to RSS Feed
- Permalink
- Report Inappropriate Content
Once you have that, what will be your next step? Some sort of count of days per event?
Helpful resources
| User | Count |
|---|---|
| 22 | |
| 11 | |
| 8 | |
| 6 | |
| 6 |
| User | Count |
|---|---|
| 26 | |
| 13 | |
| 11 | |
| 9 | |
| 6 |


