Party with Power BI’s own Guy in a Cube
Power BI is turning 10! Tune in for a special live episode on July 24 with behind-the-scenes stories, product evolution highlights, and a sneak peek at what’s in store for the future.
Save the date- Power BI forums
- Get Help with Power BI
- Desktop
- Service
- Report Server
- Power Query
- Mobile Apps
- Developer
- DAX Commands and Tips
- Custom Visuals Development Discussion
- Health and Life Sciences
- Power BI Spanish forums
- Translated Spanish Desktop
- Training and Consulting
- Instructor Led Training
- Dashboard in a Day for Women, by Women
- Galleries
- Data Stories Gallery
- Themes Gallery
- Contests Gallery
- Quick Measures Gallery
- Notebook Gallery
- Translytical Task Flow Gallery
- TMDL Gallery
- R Script Showcase
- Webinars and Video Gallery
- Ideas
- Custom Visuals Ideas (read-only)
- Issues
- Issues
- Events
- Upcoming Events
Enhance your career with this limited time 50% discount on Fabric and Power BI exams. Ends August 31st. Request your voucher.
- Power BI forums
- Forums
- Get Help with Power BI
- DAX Commands and Tips
- Average per row based on slicer
- Subscribe to RSS Feed
- Mark Topic as New
- Mark Topic as Read
- Float this Topic for Current User
- Bookmark
- Subscribe
- Printer Friendly Page
- Mark as New
- Bookmark
- Subscribe
- Mute
- Subscribe to RSS Feed
- Permalink
- Report Inappropriate Content
Average per row based on slicer
Hi all,
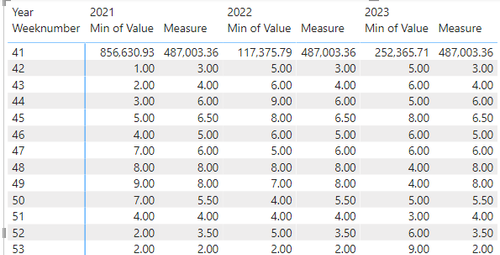
I have created a table and would like to create a measure that will average the values per row for the 2 previous years.
In the below table, the result for WEEK 41, for example, would be 487,003 (average of 2020 and 2021)
Thanks in advance
Solved! Go to Solution.
- Mark as New
- Bookmark
- Subscribe
- Mute
- Subscribe to RSS Feed
- Permalink
- Report Inappropriate Content
Hi @danielcontente ,
Here are the steps you can follow:
1. Create measure.
Measure =
var _today=YEAR(TODAY())
var _1year=
SUMX(FILTER(ALL('Table'),'Table'[Year]=_today -1&&'Table'[Weeknumber]=MAX('Table'[Weeknumber])),[Value])
var _2year=
SUMX(FILTER(ALL('Table'),'Table'[Year]=_today -2&&'Table'[Weeknumber]=MAX('Table'[Weeknumber])),[Value])
return
DIVIDE(
    _1year+_2year,2)
2. Result:
Best Regards,
Liu Yang
If this post helps, then please consider Accept it as the solution to help the other members find it more quickly
- Mark as New
- Bookmark
- Subscribe
- Mute
- Subscribe to RSS Feed
- Permalink
- Report Inappropriate Content
try like:
Average =
VAR _2020 = CALCULATE(SUM(TableName[Value]), YEAR(TableName[Date])=2020)
VAR _2021 = CALCULATE(SUM(TableName[Value]), YEAR(TableName[Date])=2021)
RETURN
(_2020+_2021)/2
- Mark as New
- Bookmark
- Subscribe
- Mute
- Subscribe to RSS Feed
- Permalink
- Report Inappropriate Content
I cannot copy the data from a picture
Dynamic based on what? Why not 2022 and 2021?
|
|
Please accept the solution when done and consider giving a thumbs up if posts are helpful. Contact me privately for support with any larger-scale BI needs, tutoring, etc. |
- Mark as New
- Bookmark
- Subscribe
- Mute
- Subscribe to RSS Feed
- Permalink
- Report Inappropriate Content
Dynamic based on the current year.
- Mark as New
- Bookmark
- Subscribe
- Mute
- Subscribe to RSS Feed
- Permalink
- Report Inappropriate Content
1. Can you share a sample of the relevant tables in your model? Or, ideally, the pbix?
2. How are the "2 previous years" determined? Is it always 2020 and 2021 or dynamic?
|
|
Please accept the solution when done and consider giving a thumbs up if posts are helpful. Contact me privately for support with any larger-scale BI needs, tutoring, etc. |
- Mark as New
- Bookmark
- Subscribe
- Mute
- Subscribe to RSS Feed
- Permalink
- Report Inappropriate Content
the previous two years are dynamic
- Mark as New
- Bookmark
- Subscribe
- Mute
- Subscribe to RSS Feed
- Permalink
- Report Inappropriate Content
Hi, the table is in the first comment (there is a picture).
Helpful resources
| User | Count |
|---|---|
| 25 | |
| 12 | |
| 8 | |
| 6 | |
| 6 |
| User | Count |
|---|---|
| 26 | |
| 12 | |
| 11 | |
| 8 | |
| 7 |


