FabCon is coming to Atlanta
Join us at FabCon Atlanta from March 16 - 20, 2026, for the ultimate Fabric, Power BI, AI and SQL community-led event. Save $200 with code FABCOMM.
Register now!- Power BI forums
- Get Help with Power BI
- Desktop
- Service
- Report Server
- Power Query
- Mobile Apps
- Developer
- DAX Commands and Tips
- Custom Visuals Development Discussion
- Health and Life Sciences
- Power BI Spanish forums
- Translated Spanish Desktop
- Training and Consulting
- Instructor Led Training
- Dashboard in a Day for Women, by Women
- Galleries
- Data Stories Gallery
- Themes Gallery
- Contests Gallery
- QuickViz Gallery
- Quick Measures Gallery
- Visual Calculations Gallery
- Notebook Gallery
- Translytical Task Flow Gallery
- TMDL Gallery
- R Script Showcase
- Webinars and Video Gallery
- Ideas
- Custom Visuals Ideas (read-only)
- Issues
- Issues
- Events
- Upcoming Events
Vote for your favorite vizzies from the Power BI Dataviz World Championship submissions. Vote now!
- Power BI forums
- Forums
- Get Help with Power BI
- Custom Visuals Development Discussion
- custom table visual
- Subscribe to RSS Feed
- Mark Topic as New
- Mark Topic as Read
- Float this Topic for Current User
- Bookmark
- Subscribe
- Printer Friendly Page
- Mark as New
- Bookmark
- Subscribe
- Mute
- Subscribe to RSS Feed
- Permalink
- Report Inappropriate Content
custom table visual
Hello,
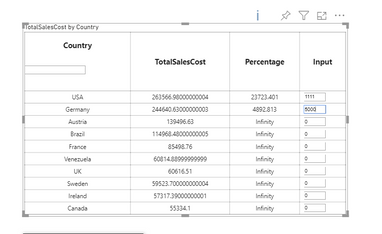
I am creating a custom visual as below,
In the input column i give some numbers and it calculates the percantage as Totalsalescost/Input
But in percentage column the result gets reflected only when i increase or decrease the size of table created.How can i solve this so that percentage column gets reflected as soon as i enter input value
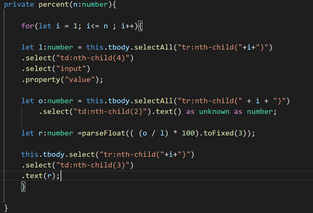
This is the snippet I used
Please help me with this
Solved! Go to Solution.
- Mark as New
- Bookmark
- Subscribe
- Mute
- Subscribe to RSS Feed
- Permalink
- Report Inappropriate Content
Hi @sheetalshettiga - it's a lot more helpful if you can paste your code as text rather than as a screengrab so that it's easier to copy into my dev environment 🙂
Looks like you're using d3, so you can refer to the event handling documentation for more details, but there's not a lot of resource on how to do this, as it's not a common use case for d3 (particularly with TypeScript), so I've had to figure some of it out.
Here's some working code with a single text element and a <p> element that proves we can update the value once we tab out of the box (so you will need to adapt to your code):
This will fire once the elment is tabbed out of, so you might need to adapt for a different event type - but it will grab the element you typed into, get the value and pass it to the percent function (which I just stubbed out to display the message with the number interpolated; it would take me too long to manually type in your function code and I don't have your DOM anyway so it wouldn't work as intended).
For reference, here's my code - I just created a blank visual and worked from there:
/** Visual.ts */
"use strict";

import "core-js/stable";
import "./../style/visual.less";
import powerbi from "powerbi-visuals-api";
import VisualConstructorOptions = powerbi.extensibility.visual.VisualConstructorOptions;
import VisualUpdateOptions = powerbi.extensibility.visual.VisualUpdateOptions;
import IVisual = powerbi.extensibility.visual.IVisual;
import EnumerateVisualObjectInstancesOptions = powerbi.EnumerateVisualObjectInstancesOptions;
import VisualObjectInstance = powerbi.VisualObjectInstance;
import DataView = powerbi.DataView;
import VisualObjectInstanceEnumerationObject = powerbi.VisualObjectInstanceEnumerationObject;
import * as d3 from 'd3';

import { VisualSettings } from "./settings";
export class Visual implements IVisual {
    private target: HTMLElement;
    private settings: VisualSettings;

    constructor(options: VisualConstructorOptions) {
        console.log('Visual constructor', options);
        this.target = options.element;
    }

    public update(options: VisualUpdateOptions) {
        this.settings = Visual.parseSettings(options && options.dataViews && options.dataViews[0]);
        console.log('Visual update', options);

        /** This is just a quick PoC */
            const container = d3.select(this.target);
            container.selectAll('*').remove();

            /** Simple test element to add output to */
            const display = container
                .append('p')
                .attr('id', 'myReplacedValue')
                .text('Initial');

            /** input with initial value */
            const inp = container
                .append('input')
                    .attr('type', 'text')
                    .attr('value', 0)
                    /** I'm doing as a fat arrow function so that 'this' is still the visual class */
                    .on('change', () => {
                        const
                            keyEvent: KeyboardEvent = <KeyboardEvent>d3.event,
                            eventTarget: EventTarget = keyEvent.target,
                            value = d3.select(<HTMLInputElement>eventTarget).node().value;
                        this.percent(Number.parseFloat(value));
                    });
    }

    private percent(n: number) {
        /**
         *  This is a stub, to prove we can get and use the number from the box
         */
         d3.select('#myReplacedValue')
            .text(`The entered percentage was ${n}.`);
    }

    private static parseSettings(dataView: DataView): VisualSettings {
        return <VisualSettings>VisualSettings.parse(dataView);
    }

    /**
     * This function gets called for each of the objects defined in the capabilities files and allows you to select which of the
     * objects and properties you want to expose to the users in the property pane.
     *
     */
    public enumerateObjectInstances(options: EnumerateVisualObjectInstancesOptions): VisualObjectInstance[] | VisualObjectInstanceEnumerationObject {
        return VisualSettings.enumerateObjectInstances(this.settings || VisualSettings.getDefault(), options);
    }
}
If you need further assistance, this is more of a web development question rather than custom visuals specifically, so you might get more readily available assistance (and better than mine) on a wider forum more geared towards JavaScript and TypeScript in general, but I'm hoping that this may get you moving, and thanks for the question - it's not something I'd tried before 🙂
Good luck!
Daniel
Did I answer your question? Mark my post as a solution!
Proud to be a Super User!
On how to ask a technical question, if you really want an answer (courtesy of SQLBI)
- Mark as New
- Bookmark
- Subscribe
- Mute
- Subscribe to RSS Feed
- Permalink
- Report Inappropriate Content
console.log(options). i got my table value null
in construytor options also element and host null why so
- Mark as New
- Bookmark
- Subscribe
- Mute
- Subscribe to RSS Feed
- Permalink
- Report Inappropriate Content
As i have attached the screenshot of custom visual table in first post which i created i am getting default value for column percentage as infinite.can you please check with this as value should be zero or empty and then based on input it should change.
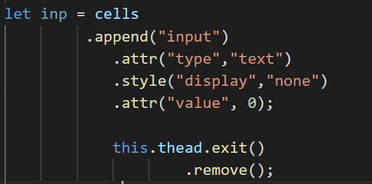
below is the snippet I used to add cell value to each row
- Mark as New
- Bookmark
- Subscribe
- Mute
- Subscribe to RSS Feed
- Permalink
- Report Inappropriate Content
Hi @sheetalshettiga,
Thanks for posting this, but only seeing a small snippet creates the following challenges for me:
- I can see that you're binding your data from your viewModel, but I can't see how this is being mapped in the first place, so you're accessing properties that I (as the reader) don't know anything about
- You're then trying to iterate through a variable named columns but the declaration of this is not in your snippet, so I can't know its structure or how it's being assembled in the first place
- I see nothing in the code that is a percentage calculation, or calls a method that works out a percentage, so the problem could actually be somewhere else not in your supplied code
As such, I can't really know what the rest of your code is doing. For example, I don't think you really need to use the .data() function twice, as the data should already be bound to your rows the first time and as a td element is a child of the tr, you can access that element's datum without having to re-bind it. This may or may not be causing you problems, but either way it will compound your code and make it harder to debug.
If you're able to provide your whole visual.ts and your capabilities.json somehow, so that I can replicate your visual locally, I will take a look at your code and see if I can make any recommendations for you, but as I anticipate it'll take me a couple of hours' work, anything you can to to help meet me halfway would be gratefully appreciated.
I find GitHub Gists a good way to share code if you're not using full source control, as you can consolidate one of more files in a single location and make this private if needs be. If you want to do something like this and DM me the link if you don't want to make it public, then I can pull the code down, try and replicate the issue and take a look for you.
Thanks,
Daniel
Did I answer your question? Mark my post as a solution!
Proud to be a Super User!
On how to ask a technical question, if you really want an answer (courtesy of SQLBI)
- Mark as New
- Bookmark
- Subscribe
- Mute
- Subscribe to RSS Feed
- Permalink
- Report Inappropriate Content
Thank you for the reply I have found the problem was with percentage calculation.
- Mark as New
- Bookmark
- Subscribe
- Mute
- Subscribe to RSS Feed
- Permalink
- Report Inappropriate Content
Yup - I just saw your original post in my email feed and figured it would be a divide by zero issue. Glad you're sorted 🙂
Did I answer your question? Mark my post as a solution!
Proud to be a Super User!
On how to ask a technical question, if you really want an answer (courtesy of SQLBI)
- Mark as New
- Bookmark
- Subscribe
- Mute
- Subscribe to RSS Feed
- Permalink
- Report Inappropriate Content
Hi @sheetalshettiga,
As the text boxes are just plain elements, they will have no event handling or logic unless you wire something up - at the bare-minimum this would be something like adding a handler for the change event. This event would need to call your percent function accordingly. The linked article has an example for a text element.
You'll need to recursively apply this event to each text element in the table, so people might typically manage this using a framework such as jQuery to take the pain out of managing this with raw JS/TS - here's an example solution from Stack Overflow that advises how to do this.
Note that if you aren't redrawing the visual DOM on update events then you will need to ensure that you don't bind the same event multiple times to the same element, as this will fire multiple event calls every time the value changes in a particular box. If you're re-drawing the elements each time the visual updates then you should be okay.
Good luck!
Daniel
Did I answer your question? Mark my post as a solution!
Proud to be a Super User!
On how to ask a technical question, if you really want an answer (courtesy of SQLBI)
- Mark as New
- Bookmark
- Subscribe
- Mute
- Subscribe to RSS Feed
- Permalink
- Report Inappropriate Content
Thank you for the respose @dm-p
I am creating text box as below how can i add event to this.
My table is getting reflected only when i resize it.
- Mark as New
- Bookmark
- Subscribe
- Mute
- Subscribe to RSS Feed
- Permalink
- Report Inappropriate Content
Hi @sheetalshettiga - it's a lot more helpful if you can paste your code as text rather than as a screengrab so that it's easier to copy into my dev environment 🙂
Looks like you're using d3, so you can refer to the event handling documentation for more details, but there's not a lot of resource on how to do this, as it's not a common use case for d3 (particularly with TypeScript), so I've had to figure some of it out.
Here's some working code with a single text element and a <p> element that proves we can update the value once we tab out of the box (so you will need to adapt to your code):
This will fire once the elment is tabbed out of, so you might need to adapt for a different event type - but it will grab the element you typed into, get the value and pass it to the percent function (which I just stubbed out to display the message with the number interpolated; it would take me too long to manually type in your function code and I don't have your DOM anyway so it wouldn't work as intended).
For reference, here's my code - I just created a blank visual and worked from there:
/** Visual.ts */
"use strict";

import "core-js/stable";
import "./../style/visual.less";
import powerbi from "powerbi-visuals-api";
import VisualConstructorOptions = powerbi.extensibility.visual.VisualConstructorOptions;
import VisualUpdateOptions = powerbi.extensibility.visual.VisualUpdateOptions;
import IVisual = powerbi.extensibility.visual.IVisual;
import EnumerateVisualObjectInstancesOptions = powerbi.EnumerateVisualObjectInstancesOptions;
import VisualObjectInstance = powerbi.VisualObjectInstance;
import DataView = powerbi.DataView;
import VisualObjectInstanceEnumerationObject = powerbi.VisualObjectInstanceEnumerationObject;
import * as d3 from 'd3';

import { VisualSettings } from "./settings";
export class Visual implements IVisual {
    private target: HTMLElement;
    private settings: VisualSettings;

    constructor(options: VisualConstructorOptions) {
        console.log('Visual constructor', options);
        this.target = options.element;
    }

    public update(options: VisualUpdateOptions) {
        this.settings = Visual.parseSettings(options && options.dataViews && options.dataViews[0]);
        console.log('Visual update', options);

        /** This is just a quick PoC */
            const container = d3.select(this.target);
            container.selectAll('*').remove();

            /** Simple test element to add output to */
            const display = container
                .append('p')
                .attr('id', 'myReplacedValue')
                .text('Initial');

            /** input with initial value */
            const inp = container
                .append('input')
                    .attr('type', 'text')
                    .attr('value', 0)
                    /** I'm doing as a fat arrow function so that 'this' is still the visual class */
                    .on('change', () => {
                        const
                            keyEvent: KeyboardEvent = <KeyboardEvent>d3.event,
                            eventTarget: EventTarget = keyEvent.target,
                            value = d3.select(<HTMLInputElement>eventTarget).node().value;
                        this.percent(Number.parseFloat(value));
                    });
    }

    private percent(n: number) {
        /**
         *  This is a stub, to prove we can get and use the number from the box
         */
         d3.select('#myReplacedValue')
            .text(`The entered percentage was ${n}.`);
    }

    private static parseSettings(dataView: DataView): VisualSettings {
        return <VisualSettings>VisualSettings.parse(dataView);
    }

    /**
     * This function gets called for each of the objects defined in the capabilities files and allows you to select which of the
     * objects and properties you want to expose to the users in the property pane.
     *
     */
    public enumerateObjectInstances(options: EnumerateVisualObjectInstancesOptions): VisualObjectInstance[] | VisualObjectInstanceEnumerationObject {
        return VisualSettings.enumerateObjectInstances(this.settings || VisualSettings.getDefault(), options);
    }
}
If you need further assistance, this is more of a web development question rather than custom visuals specifically, so you might get more readily available assistance (and better than mine) on a wider forum more geared towards JavaScript and TypeScript in general, but I'm hoping that this may get you moving, and thanks for the question - it's not something I'd tried before 🙂
Good luck!
Daniel
Did I answer your question? Mark my post as a solution!
Proud to be a Super User!
On how to ask a technical question, if you really want an answer (courtesy of SQLBI)
- Mark as New
- Bookmark
- Subscribe
- Mute
- Subscribe to RSS Feed
- Permalink
- Report Inappropriate Content
Thank you @dm-p you took time to solve my problem.
I was not known how to use keyEvent.The explanation and example you provided helped me understanding it better.Thank you for solving it.
Helpful resources

Power BI Dataviz World Championships
Vote for your favorite vizzies from the Power BI World Championship submissions!

Join our Community Sticker Challenge 2026
If you love stickers, then you will definitely want to check out our Community Sticker Challenge!

Power BI Monthly Update - January 2026
Check out the January 2026 Power BI update to learn about new features.


