Join the Fabric User Panel to shape the future of Fabric.
Share feedback directly with Fabric product managers, participate in targeted research studies and influence the Fabric roadmap.
Sign up now- Power BI forums
- Get Help with Power BI
- Desktop
- Service
- Report Server
- Power Query
- Mobile Apps
- Developer
- DAX Commands and Tips
- Custom Visuals Development Discussion
- Health and Life Sciences
- Power BI Spanish forums
- Translated Spanish Desktop
- Training and Consulting
- Instructor Led Training
- Dashboard in a Day for Women, by Women
- Galleries
- Data Stories Gallery
- Themes Gallery
- Contests Gallery
- QuickViz Gallery
- Quick Measures Gallery
- Visual Calculations Gallery
- Notebook Gallery
- Translytical Task Flow Gallery
- TMDL Gallery
- R Script Showcase
- Webinars and Video Gallery
- Ideas
- Custom Visuals Ideas (read-only)
- Issues
- Issues
- Events
- Upcoming Events
Get Fabric certified for FREE! Don't miss your chance! Learn more
- Power BI forums
- Forums
- Get Help with Power BI
- Custom Visuals Development Discussion
- Re: Using What if parameters
- Subscribe to RSS Feed
- Mark Topic as New
- Mark Topic as Read
- Float this Topic for Current User
- Bookmark
- Subscribe
- Printer Friendly Page
- Mark as New
- Bookmark
- Subscribe
- Mute
- Subscribe to RSS Feed
- Permalink
- Report Inappropriate Content
Using What if parameters
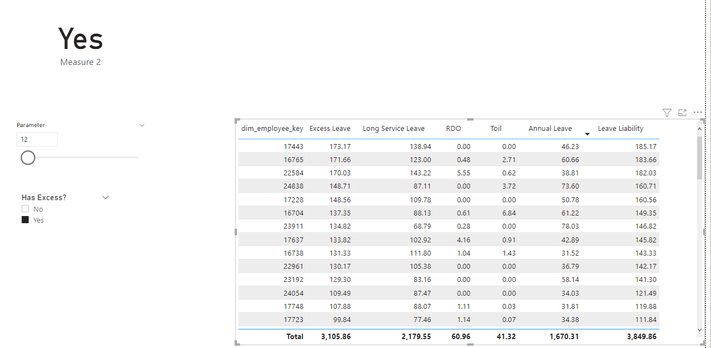
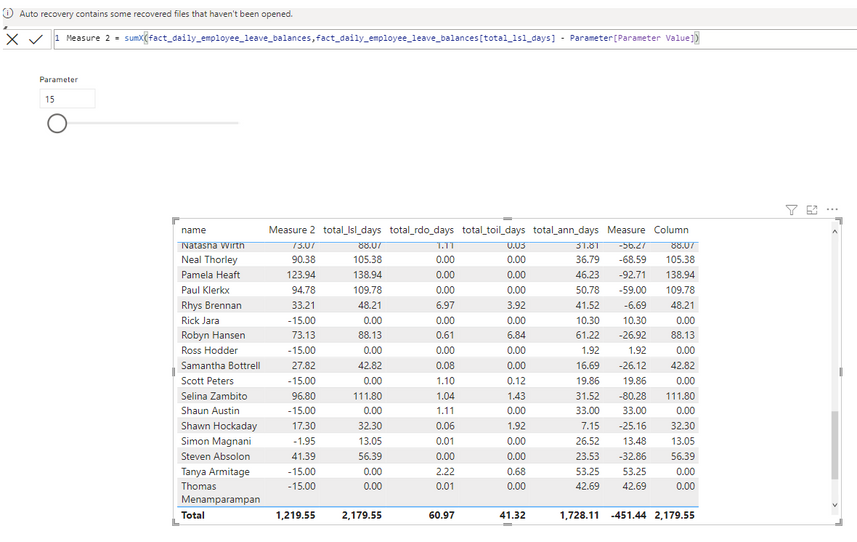
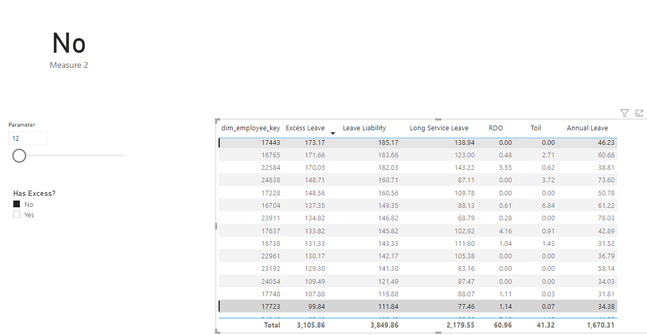
The filter context seems to get altered while trying to use a what if parameter in a calculation
The data set for the below table is in a star schema format. A fact table linked to two dimension tables one being the employee dimension and another being the date dimension
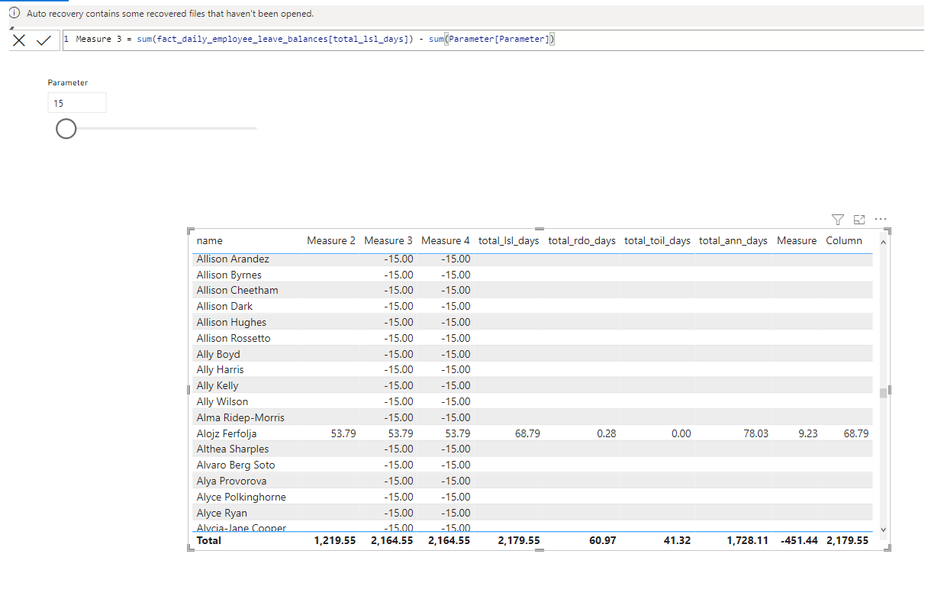
Why does the below measure using sum alter the filter context and introduce more rows? But the above sumx seems to be working correctly. What is happening with sum and sumx?
- Mark as New
- Bookmark
- Subscribe
- Mute
- Subscribe to RSS Feed
- Permalink
- Report Inappropriate Content
Thanks to all those who replied. I have solved my problem by creating a measure and using applying a filter
- Mark as New
- Bookmark
- Subscribe
- Mute
- Subscribe to RSS Feed
- Permalink
- Report Inappropriate Content
How do i upload my pbix file?
- Mark as New
- Bookmark
- Subscribe
- Mute
- Subscribe to RSS Feed
- Permalink
- Report Inappropriate Content
- Mark as New
- Bookmark
- Subscribe
- Mute
- Subscribe to RSS Feed
- Permalink
- Report Inappropriate Content
Please provide sanitized sample data that fully covers your issue. If you paste the data into a table in your post or use one of the file services it will be easier to assist you. I cannot use screenshots of your source data.
Please show the expected outcome based on the sample data you provided. Screenshots of the expected outcome are ok.
https://community.powerbi.com/t5/Desktop/How-to-Get-Your-Question-Answered-Quickly/m-p/1447523
- Mark as New
- Bookmark
- Subscribe
- Mute
- Subscribe to RSS Feed
- Permalink
- Report Inappropriate Content
| dim_employee_key | Excess Leave | Leave Liability | total_ann_hours | total_ann_days | total_toil_hours | total_toil_days | total_rdo_hours | total_rdo_days | total_lsl_hours | total_lsl_days | total_hours | total_days |
| 15268 | 99.88480595 | 111.8848 | 359.913 | 49.64317 | 0.63 | 0.086897 | 0 | 0 | 451.2519 | 62.24163 | 811.7948 | 111.9717 |
| 17138 | 46.05777926 | 58.05778 | 300.8388 | 39.58405 | 0 | 0 | 0 | 0 | 140.4003 | 18.47373 | 441.2391 | 58.05778 |
| 16705 | 165.0006797 | 177.0007 | 391.0808 | 53.94217 | 0 | 0 | 0 | 0 | 892.1742 | 123.0585 | 1283.255 | 177.0007 |
| 16516 | 103.7715007 | 115.7715 | 173.1716 | 39.80956 | -5.00E-08 | -1.00E-08 | 0 | 0 | 330.4344 | 75.96194 | 503.606 | 115.7715 |
| 16704 | 137.3544887 | 149.3545 | 443.8427 | 61.21969 | 49.6 | 6.841379 | 4.4 | 0.606897 | 638.9773 | 88.1348 | 1136.82 | 156.8028 |
| 16998 | 95.66456501 | 107.6646 | 155.5548 | 21.45583 | 3.00E-08 | 1.00E-08 | 0 | 0 | 625.0133 | 86.20873 | 780.5681 | 107.6646 |
| 15288 | 118.2670137 | 130.267 | 276.9212 | 36.437 | 0 | 0 | 0 | 0 | 713.1081 | 93.83001 | 990.0293 | 130.267 |
| 15008 | 48.66990236 | 60.6699 | 152.0248 | 20.96893 | 8.05 | 1.110345 | 32.2 | 4.441379 | 287.832 | 39.70097 | 480.1068 | 66.22163 |
| 16397 | 118.9349114 | 130.9349 | 284.5334 | 39.24598 | 0 | 0 | 0 | 0 | 664.7447 | 91.68893 | 949.2781 | 130.9349 |
| 16260 | 116.4790248 | 128.479 | 401.1373 | 55.32928 | 1.75 | 0.241379 | 7.7 | 1.062069 | 530.3356 | 73.14974 | 940.9229 | 129.7825 |
| 16872 | 74.76973564 | 86.76974 | 468.0403 | 64.55728 | 1.6 | 0.22069 | 0 | 0 | 161.0403 | 22.21246 | 630.6806 | 86.99043 |
| 15481 | 91.7866822 | 103.7867 | 392.9281 | 51.70107 | 0 | 0 | 0 | 0 | 395.8507 | 52.08562 | 788.7788 | 103.7867 |
| 16728 | 123.7947723 | 135.7948 | 382.0948 | 52.70273 | 0.75 | 0.103448 | 0.1 | 0.013793 | 602.4173 | 83.09205 | 985.3621 | 135.912 |
| 17038 | 125.055147 | 137.0551 | 396.6848 | 54.71514 | 4 | 0.551724 | 28.155 | 3.883448 | 596.965 | 82.34001 | 1025.805 | 141.4903 |
| 14859 | 182.8215086 | 194.8215 | 406.9221 | 53.54238 | 0.5 | 0.065789 | 0 | 0 | 1073.721 | 141.2791 | 1481.143 | 194.8873 |
| 16957 | -10.91587558 | 1.084124 | 7.290658 | 0.959297 | 0 | 0 | 0 | 0 | 0.948688 | 0.124827 | 8.239346 | 1.084124 |
| 16202 | 158.1940327 | 170.194 | 453.9812 | 59.73437 | 0 | 0 | 0 | 0 | 839.4934 | 110.4597 | 1293.475 | 170.194 |
| 16373 | 126.4305984 | 138.4306 | 196.5224 | 25.85821 | 0 | 0 | 0 | 0 | 855.5502 | 112.5724 | 1052.073 | 138.4306 |
| 16765 | 171.66429 | 183.6643 | 439.8048 | 60.66273 | 19.625 | 2.706897 | 3.475 | 0.47931 | 891.7613 | 123.0016 | 1354.666 | 186.8505 |
- Mark as New
- Bookmark
- Subscribe
- Mute
- Subscribe to RSS Feed
- Permalink
- Report Inappropriate Content
Above is a sample of the data
Excess leave and leave liability are measures

Can you help me with a solution
Thanks
Chitra
- Mark as New
- Bookmark
- Subscribe
- Mute
- Subscribe to RSS Feed
- Permalink
- Report Inappropriate Content
| dim_employee_key | Excess Leave | Leave Liability | Long Service Leave | RDO | Toil | Annual Leave |
| 17443 | 173.1684 | 185.1684 | 138.9388 | 0 | 0 | 46.22962 |
| 16765 | 171.6643 | 183.6643 | 123.0016 | 0.47931 | 2.706897 | 60.66273 |
| 22584 | 170.0329 | 182.0329 | 143.2212 | 5.548966 | 0.62069 | 38.81162 |
| 24838 | 148.7087 | 160.7087 | 87.11003 | 0 | 3.724138 | 73.59868 |
| 17228 | 148.5594 | 160.5594 | 109.7822 | 0 | 0 | 50.77721 |
| 16704 | 137.3545 | 149.3545 | 88.1348 | 0.606897 | 6.841379 | 61.21969 |
| 23911 | 134.8182 | 146.8182 | 68.79181 | 0.282759 | 0 | 78.02642 |
| 17637 | 133.8193 | 145.8193 | 102.9248 | 4.158621 | 0.910345 | 42.89445 |
| 16738 | 131.3291 | 143.3291 | 111.8043 | 1.044138 | 1.428138 | 31.5248 |
| 22961 | 130.1744 | 142.1744 | 105.3823 | 0 | 0 | 36.79204 |
| 23192 | 129.2997 | 141.2997 | 83.1591 | -1.00E-08 | 0 | 58.1406 |
| 24054 | 109.4947 | 121.4947 | 87.46628 | 0 | 0 | 34.0284 |
| 17748 | 107.8799 | 119.8799 | 88.07395 | 1.110345 | 0.034483 | 31.80595 |
| 17723 | 99.84228 | 111.8423 | 77.4601 | 1.142814 | 0.068966 | 34.38218 |
| 24340 | 88.48421 | 100.4842 | 58.50008 | 7.117241 | 4.448276 | 41.98413 |
| 23994 | 86.70156 | 98.70156 | 66.62513 | 0 | 0 | 32.07643 |
| 24371 | 84.03493 | 96.03493 | 57.95841 | 3.468966 | 5.344828 | 38.07652 |
| 17429 | 82.54076 | 94.54076 | 39.76928 | -1.00E-08 | 0.232919 | 54.77148 |
| 24833 | 77.7271 | 89.7271 | 48.20835 | 6.972414 | 3.917241 | 41.51875 |
| 16723 | 73.72636 | 85.72636 | 47.47743 | 0.00069 | 0 | 38.24893 |
| 23620 | 67.91624 | 79.91624 | 56.38898 | 0 | 0 | 23.52725 |
| 24585 | 66.21439 | 78.21439 | 53.62505 | 0 | 0.068966 | 24.58934 |
| 23468 | 61.93547 | 73.93547 | 66.83145 | 2.22069 | 0 | 7.104018 |
| 23413 | 52.24279 | 64.24279 | 53.68908 | 2.118421 | 0.052632 | 10.55371 |
| 23479 | 47.50951 | 59.50951 | 42.81528 | 0.075862 | 0 | 16.69424 |
| 16710 | 46.65558 | 58.65558 | 23.0563 | 4.268966 | 5.482759 | 35.59928 |
| 25585 | 41.24988 | 53.24988 | 0 | 2.22069 | 0.682759 | 53.24988 |
| 23058 | 39.45478 | 51.45478 | 28.16607 | 0 | 0 | 23.28872 |
Above is my sample data.
Table is fact_daily_employee_leave_balances
Excess Leave and Leave Liability are measures
Can somebody please help me with a solution
Thanks
Chitra
Helpful resources

Join our Fabric User Panel
Share feedback directly with Fabric product managers, participate in targeted research studies and influence the Fabric roadmap.

Join our Community Sticker Challenge 2026
If you love stickers, then you will definitely want to check out our Community Sticker Challenge!

Power BI Monthly Update - January 2026
Check out the January 2026 Power BI update to learn about new features.


