This is best Fabric, Power BI, SQL and AI community event. How do we know? The last event sold out! Save €200 with code FABCMTY200.
Register nowA new Data Days event is coming soon! This time we’re going bigger than ever. Fabric, Power BI, SQL, AI and more. Don't miss out.
Hi everyone,
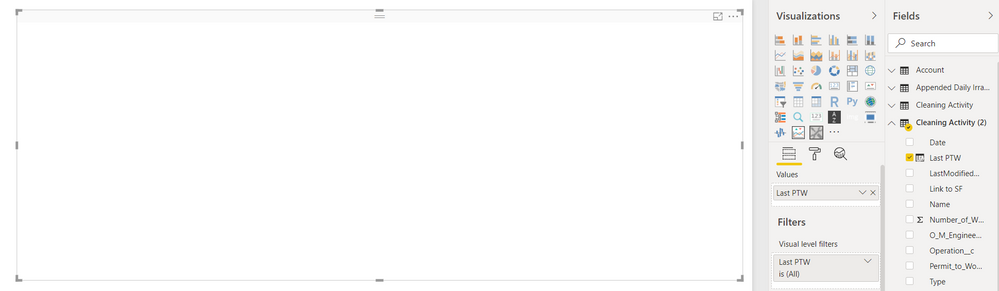
I'm trying to make R Custom visuals with plotly and have closely followed the guide outlined here from RADACAD. However, when I imported the custom visual to Power BI, it gave me a blank visual and I do not get any error messages:
Blank visual in Power BI using Iris Dataset
Whereas I expect to see this:
Below is the R script I used (the default when downloading sampleRHTMLVisual):
source('./r_files/flatten_HTML.r')
############### Library Declarations ###############
libraryRequireInstall("ggplot2");
libraryRequireInstall("plotly")
####################################################
################### Actual code ####################
g = qplot(`Petal.Length`, data = iris, fill = `Species`, main = Sys.time());
####################################################
############# Create and save widget ###############
p = ggplotly(g);
internalSaveWidget(p, 'out.html');
####################################################Has anyone encountered this issue before?
Check out the May 2026 Power BI update to learn about new features.
Sign up to receive a private message when registration opens and key events begin.
If you have recently started exploring Fabric, we'd love to hear how it's going. Your feedback can help with product improvements.