Get certified for free when you join Fabric Data Days 2026 and dive into Fabric, Power BI, SQL, AI, and other essential data skills.
Join nowJuly 7 - July 17 | Round 2 of the Power BI Dataviz World Championships. Don't miss your chance! Learn more
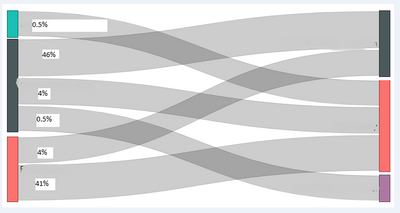
I have downloaded the sankey visual 1.10.0 from the Marketplace but it appears to me that the precentage weight isn't accurately show the difference between flows.
From the source to destination I have flows ranging from 0.5 to 4 to 46% but the flow widths are a similar size for 0.5% and 4% and the 46% flow isn't much wider than either of them. My flow precentages are (0.5%, 0.5%, 4%, 4%, 41%, 46%)
If I don't have a precentage count calculation on the weight I get more realistic thicknesses but I would like to see the % that flows from source to destination
Am I using the Sankey correctly?
Do you want to show percentage values? Am i correct?
Ignat Vilesov,
Software Engineer
Microsoft Power BI Custom Visuals
Yes and have the precentage value be represented by the weight/thickness of the connector. Not sure if the precentage should be broken down by source or destination or part there of. What I mean by that is maybe the option to decide if the precentage is based on the source, the destination or each element within the source, destination
Can you share a pbix (Power BI) report to assign it to the task for testing?
Ignat Vilesov,
Software Engineer
Microsoft Power BI Custom Visuals
Thanks. We got the email.
Ignat Vilesov,
Software Engineer
Microsoft Power BI Custom Visuals
Join us in Barcelona for FabCon and SQLCon, the Fabric, Power BI, SQL, and AI community event. Save €200 with code FABCMTY200.
Join Data Days 2026: 60 days of free live/on-demand sessions, challenges, study groups, and certification opportunities.
| User | Count |
|---|---|
| 3 | |
| 3 | |
| 2 | |
| 1 | |
| 1 |