FabCon is coming to Atlanta
Join us at FabCon Atlanta from March 16 - 20, 2026, for the ultimate Fabric, Power BI, AI and SQL community-led event. Save $200 with code FABCOMM.
Register now!- Power BI forums
- Get Help with Power BI
- Desktop
- Service
- Report Server
- Power Query
- Mobile Apps
- Developer
- DAX Commands and Tips
- Custom Visuals Development Discussion
- Health and Life Sciences
- Power BI Spanish forums
- Translated Spanish Desktop
- Training and Consulting
- Instructor Led Training
- Dashboard in a Day for Women, by Women
- Galleries
- Data Stories Gallery
- Themes Gallery
- Contests Gallery
- QuickViz Gallery
- Quick Measures Gallery
- Visual Calculations Gallery
- Notebook Gallery
- Translytical Task Flow Gallery
- TMDL Gallery
- R Script Showcase
- Webinars and Video Gallery
- Ideas
- Custom Visuals Ideas (read-only)
- Issues
- Issues
- Events
- Upcoming Events
The Power BI Data Visualization World Championships is back! Get ahead of the game and start preparing now! Learn more
- Power BI forums
- Forums
- Get Help with Power BI
- Custom Visuals Development Discussion
- Re: Memory leaks in Power BI custom visuals
- Subscribe to RSS Feed
- Mark Topic as New
- Mark Topic as Read
- Float this Topic for Current User
- Bookmark
- Subscribe
- Printer Friendly Page
- Mark as New
- Bookmark
- Subscribe
- Mute
- Subscribe to RSS Feed
- Permalink
- Report Inappropriate Content
Memory leaks in Power BI custom visuals
In the last few days I connected the dots between several requests I received, and I've found that when custom visuals are created and removed frequently in a report, the browser (or the process CefSharp.BrowserSubprocess.exe used by PBI Desktop) grows in memory until it becomes unusable.
The native visuals don't seem affected by that.
Crashing Power BI seems incredibly easy:
- Create a table with 10 rows in a new PBIX file
- Import the Chiclet slicer custom visual from the store
- Create a Chiclet slicer applying the column with 10 rows
- Copy and paste the slicer 9 times around the same page
- Duplicate Page1
- Save the file (just in case)
- Open Task Manager and switch back and forth between page 1 and page 2 for a while
- The process CefSharp.BrowserSubprocess will grow in memory
- Switch between one page and another will slow down progressively, usually after 2GB of RAM consumed by the process the response time is unmanageable
- Publish the file on powerbi.com
- Switch back and forth between page 1 and page 2 for a while
- This time your browser will grow in memory usage...
If I use a regular slicer, the issue is not visible. In reality, I see 4-5 KB lost every time I switch between pages, but it's a fraction of the cost of the custom visuals.
I tried with other custom visuals, made by different developers, and I've got the same result.
I have seen in Power BI forum several threads related to the presence of the CefSharp.BrowserSubprocess process, but I didn't see an explanation of the reason, which is not really related to that process considering that the issue also happens on a regular browser for published reports.
To my eyes, this is some memory leak issue related to custom visuals when the user switch between pages of the same report. But, of course, I could be wrong, so in this case any further information would be useful.
Is this something that other noticed?
Any comment from MS?
Thanks,
Marco
- Mark as New
- Bookmark
- Subscribe
- Mute
- Subscribe to RSS Feed
- Permalink
- Report Inappropriate Content
- Mark as New
- Bookmark
- Subscribe
- Mute
- Subscribe to RSS Feed
- Permalink
- Report Inappropriate Content
Buenas tardes,
Al actualizar a la nueva versión de diciembre de 2019 me sale el error "CefSharp.BrowserSubprocess dejó de funcionar".
Reinstale versiones anteriores y el error persiste. Actualmente he dejado la versión de diciembre de 2019
La memoria consumida crece al cambiar de página y cuando activo las vista de marcadores hasta cerrarse el fichero. Las visualizaciones personalizadas que utilizo son "chicletslicer" y "textfilter".
Creo que el mayor problema al que me he enfretado ya que todos mis informe están inutilizados por este hecho.
Pido ayuda.
Gracias.
- Mark as New
- Bookmark
- Subscribe
- Mute
- Subscribe to RSS Feed
- Permalink
- Report Inappropriate Content
Este es el consumo de memoria cuando se activa el panel de marcadores. Hasta que se cierra.
Si abro el fichero y voy al panel de marcadores queda inutilizable el informe.
- Mark as New
- Bookmark
- Subscribe
- Mute
- Subscribe to RSS Feed
- Permalink
- Report Inappropriate Content
Hello there, I'm a new user and I already noticed the memory leak "cefsharp.browsersubprocess.exe".
I'm using Power BI Desktop under Win7 SP1.
Is there any solution yet?
Thanks.
- Mark as New
- Bookmark
- Subscribe
- Mute
- Subscribe to RSS Feed
- Permalink
- Report Inappropriate Content
Is this being addressed? I am experiencing the same issue.
- Mark as New
- Bookmark
- Subscribe
- Mute
- Subscribe to RSS Feed
- Permalink
- Report Inappropriate Content
Hi @Anonymous
Power BI Custom Visuals API team is working on improving performance.
Can you share any details on when you face the same issues?
Ignat Vilesov,
Software Engineer
Microsoft Power BI Custom Visuals
- Mark as New
- Bookmark
- Subscribe
- Mute
- Subscribe to RSS Feed
- Permalink
- Report Inappropriate Content
Hi @v-viig ,
a new guy bothering you for updates... 😉
Any news on this issue? We're currently also in the middle of two proof of concepts with enterprise customers and without solving this performance issue we're probably going to loose against Qlik Sense.
Thanks for your effort & Kind regards,
Gerrit
- Mark as New
- Bookmark
- Subscribe
- Mute
- Subscribe to RSS Feed
- Permalink
- Report Inappropriate Content
Hi Gerrit,
Custom Visuals consume less memory if they use last versions of API.
Regarding tihs, we recommend developers to migrate their visuals to latest API.
What exact troubles do you have with performance?
Kind Regards,
Evgenii Elkin,
Software Engineer
Microsoft Power BI Custom Visuals
pbicvsupport@microsoft.com
- Mark as New
- Bookmark
- Subscribe
- Mute
- Subscribe to RSS Feed
- Permalink
- Report Inappropriate Content
Hi Ignat,
In my case, the problem seems fixed in Power BI Desktop and Power BI Services while using certain browsers (Chrome, Safari and Firefox). But when using IE or Edge, the memory leak persists.
I believe the memory footprint is still been worked on, but i'm afraid using both Microsoft's browsers, the memory leak persists.
In my case, I detected the same issue Marco reported, but only using PowerApps custom visual (currently in preview mode) and Argis maps. At the time, I found no other custom visuals with the same issue.
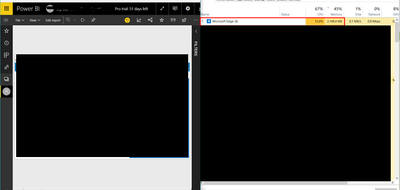
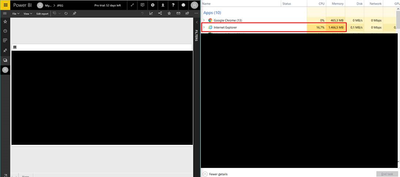
The main problem is that any of the mentioned browsers release no memory at any time (I left the computer on for 2 hours and memory was still taken). What makes it even worse, is that IE doesn't crash and restart by itself, but I shows an error in the report and stops loading as shown in the images at the end. Edge manages a bit better and reboots by itself.
Some technical details....
- Independent of the OS
- Only occurs in Edge and IE. Couldn't repro in Chrome, Safari and Firefox
- IE crashes when reaching 1.5GB memory. Edge crashes when reaching 5GB memory (I miss a test here, what occurs when the computer doesn't have that much memory available)
- It's not exclusive of custom visuals (as far as I am concerned). If you move quickly enough between pages, the browser still increases in memory consumption without releasing any, with the same ending. In this case, IE does release the memory after a while.


Regards,
Ignacio
- Mark as New
- Bookmark
- Subscribe
- Mute
- Subscribe to RSS Feed
- Permalink
- Report Inappropriate Content
It looks like this issue might be related to these specific visuals.
Can you share any repro steps?
Ignat Vilesov,
Software Engineer
Microsoft Power BI Custom Visuals
- Mark as New
- Bookmark
- Subscribe
- Mute
- Subscribe to RSS Feed
- Permalink
- Report Inappropriate Content
Yes, sure!
0. Open app.powerbi in IE 11 or Edge
1. Create a new report (Desktop/Service) with a datasource of your choice, AdventureWorks will do.
2. Create 2 pages in your report and in one or both pages insert a PowerApp visual or ESRI Maps visual, with the corresponding fields.
3. Navigate the report going from page 1 to page 2, to page 1, and again.
4. If desired, open Task Manager to review how memory incresases without being released at any moment. In IE it'll crash when reaching 1.5gb aprox and Edge 4/5gb aprox.
Please tell me if you need any more info!
Ignacio
- Mark as New
- Bookmark
- Subscribe
- Mute
- Subscribe to RSS Feed
- Permalink
- Report Inappropriate Content
Hi Ignacio,
Thank you for detailed repro steps. We'll share them to proper team for further investigation.
Ignat Vilesov,
Software Engineer
Microsoft Power BI Custom Visuals
- Mark as New
- Bookmark
- Subscribe
- Mute
- Subscribe to RSS Feed
- Permalink
- Report Inappropriate Content
Has this issue been fixed?
- Mark as New
- Bookmark
- Subscribe
- Mute
- Subscribe to RSS Feed
- Permalink
- Report Inappropriate Content
The primary memory leak was fixed.
Currently we're working on other methods to reduce memory footprint.
Ignat Vilesov,
Software Engineer
Microsoft Power BI Custom Visuals
- Mark as New
- Bookmark
- Subscribe
- Mute
- Subscribe to RSS Feed
- Permalink
- Report Inappropriate Content
I had to use clicklet slicer, because it enforces the user to always select one.
I had to use card with states in order to display fore color as green when value is greater than zero. Else red.
All these features are not available in default visuals.
- Mark as New
- Bookmark
- Subscribe
- Mute
- Subscribe to RSS Feed
- Permalink
- Report Inappropriate Content
Power BI Custom Visuals API team is working on improving performance of custom visuals.
That process is taking some time since we have to modify large bunch of code.
Ignat Vilesov,
Software Engineer
Microsoft Power BI Custom Visuals
- Mark as New
- Bookmark
- Subscribe
- Mute
- Subscribe to RSS Feed
- Permalink
- Report Inappropriate Content
Sounds good, place keep us updated 🙂 We're also seeing major performance issues using 30+ 'card with states' on a single page. Desktop also crashes when used too long (the memory leak issue) although closing/opening Desktop helps (if you remember :-))
- Mark as New
- Bookmark
- Subscribe
- Mute
- Subscribe to RSS Feed
- Permalink
- Report Inappropriate Content
Thank you for the details.
We'll update status once we have any news.
Ignat Vilesov,
Software Engineer
Microsoft Power BI Custom Visuals
- Mark as New
- Bookmark
- Subscribe
- Mute
- Subscribe to RSS Feed
- Permalink
- Report Inappropriate Content
Any news on this? We have several dashboards running at customer sites where we've had to move away from custom visuals due to the slow response and difficulty in building reports with lots of custom visuals (+20)
- Mark as New
- Bookmark
- Subscribe
- Mute
- Subscribe to RSS Feed
- Permalink
- Report Inappropriate Content
This is having a severe impact on our reporting and is causing huge spikes in CefSharp.BroswerSubprocess for me. I have been pulling my hair out redesigning measures and entire reports and it seems like it is related to the use of custom visuals (mostly the Card with States visual) that is used in our dashboards. Having dashboards without conditional formatting is a no go for us and we really need a fix as soon as possible.
We're an enterprise customer with over 800 users and use of custom visuals is needed where standard Power BI visuals do not meet requirements, do you guys have an ETA on this as I'm currently in a situation where I cannot even edit some of my reports and need to reconsider what we can and can't make available to our end users.
Thanks.
Helpful resources

Power BI Dataviz World Championships
The Power BI Data Visualization World Championships is back! Get ahead of the game and start preparing now!

| User | Count |
|---|---|
| 1 | |
| 1 | |
| 1 | |
| 1 | |
| 1 |


