This is best Fabric, Power BI, SQL and AI community event. How do we know? The last event sold out! Save €200 with code FABCMTY200.
Register nowThe Fabric community is upgrading! Read all of the details including the timeline and what you can expect. Learn more
Hi,
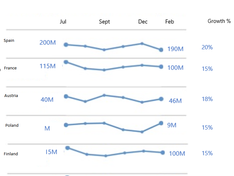
I need to create visual as above.I am not able to find any visual for same.Please suggest what custom visual can do this job.Months in top are also dynamic.
Thanks,
Pracy
Hi @pracy,
There are a number of sparkline-based custom visuals you can try, if you haven't already:
I'm not sure if these align 100% with your requirements. If not, then options are to either develop such a visual yourself, or there are some consulting services you can engage with to have this developed.
Regards,
Daniel
Proud to be a Super User!
On how to ask a technical question, if you really want an answer (courtesy of SQLBI)
Join us in Barcelona for FabCon and SQLCon, the Fabric, Power BI, SQL, and AI community event. Save €200 with code FABCMTY200.