- Power BI forums
- Updates
- News & Announcements
- Get Help with Power BI
- Desktop
- Service
- Report Server
- Power Query
- Mobile Apps
- Developer
- DAX Commands and Tips
- Custom Visuals Development Discussion
- Health and Life Sciences
- Power BI Spanish forums
- Translated Spanish Desktop
- Power Platform Integration - Better Together!
- Power Platform Integrations (Read-only)
- Power Platform and Dynamics 365 Integrations (Read-only)
- Training and Consulting
- Instructor Led Training
- Dashboard in a Day for Women, by Women
- Galleries
- Community Connections & How-To Videos
- COVID-19 Data Stories Gallery
- Themes Gallery
- Data Stories Gallery
- R Script Showcase
- Webinars and Video Gallery
- Quick Measures Gallery
- 2021 MSBizAppsSummit Gallery
- 2020 MSBizAppsSummit Gallery
- 2019 MSBizAppsSummit Gallery
- Events
- Ideas
- Custom Visuals Ideas
- Issues
- Issues
- Events
- Upcoming Events
- Community Blog
- Power BI Community Blog
- Custom Visuals Community Blog
- Community Support
- Community Accounts & Registration
- Using the Community
- Community Feedback
Register now to learn Fabric in free live sessions led by the best Microsoft experts. From Apr 16 to May 9, in English and Spanish.
- Power BI forums
- Galleries
- COVID-19 Data Stories Gallery
- USA Facts COVID-19 County level report with per ca...
USA Facts COVID-19 County level report with per capita detail
03-31-2020 10:48 AM


- Mark as New
- Bookmark
- Subscribe
- Mute
- Subscribe to RSS Feed
- Permalink
- Report Inappropriate Content
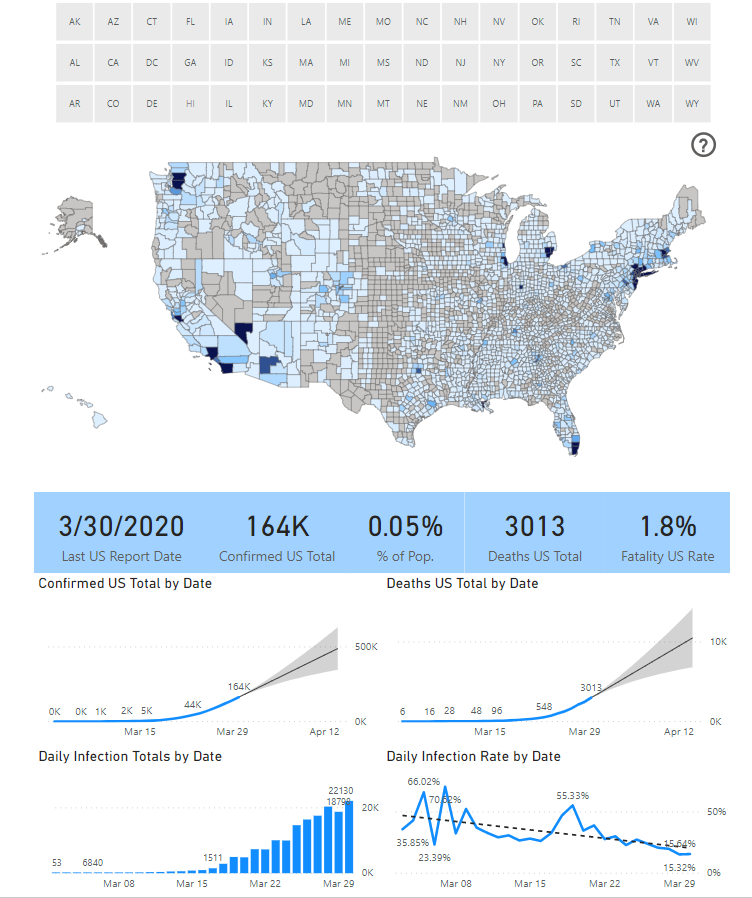
USA Facts COVID-19 County level report with per capita detail
As many in the community have found, the publicly available John Hopkins data sets were changed in a way that didn't provide detail information for United States citizens.
Moving forward I am now leveraging data from USA Facts as this represents better granularity and localized infection details.
https://usafacts.org/visualizations/coronavirus-covid-19-spread-map/
I also added US Census data for 2019 to get a more actuate population vs infection ratio using the FIPS codes for county level infection rates per capita.
https://www.census.gov/data/datasets/time-series/demo/popest/2010s-counties-total.html
Finally this report is using the letter page layout which I feel works better on a mobile device.
eyJrIjoiZGFiZTJhODItMGQ4OC00Y2ViLTgxOWEtZTUwNDBmMjkwN2RiIiwidCI6ImUwMWFlYzQyLTk5ZTAtNDYyNC05YzUyLWU1OWY3NmY2MWJjNCJ9