- Power BI forums
- Updates
- News & Announcements
- Get Help with Power BI
- Desktop
- Service
- Report Server
- Power Query
- Mobile Apps
- Developer
- DAX Commands and Tips
- Custom Visuals Development Discussion
- Health and Life Sciences
- Power BI Spanish forums
- Translated Spanish Desktop
- Power Platform Integration - Better Together!
- Power Platform Integrations (Read-only)
- Power Platform and Dynamics 365 Integrations (Read-only)
- Training and Consulting
- Instructor Led Training
- Dashboard in a Day for Women, by Women
- Galleries
- Community Connections & How-To Videos
- COVID-19 Data Stories Gallery
- Themes Gallery
- Data Stories Gallery
- R Script Showcase
- Webinars and Video Gallery
- Quick Measures Gallery
- 2021 MSBizAppsSummit Gallery
- 2020 MSBizAppsSummit Gallery
- 2019 MSBizAppsSummit Gallery
- Events
- Ideas
- Custom Visuals Ideas
- Issues
- Issues
- Events
- Upcoming Events
- Community Blog
- Power BI Community Blog
- Custom Visuals Community Blog
- Community Support
- Community Accounts & Registration
- Using the Community
- Community Feedback
Earn a 50% discount on the DP-600 certification exam by completing the Fabric 30 Days to Learn It challenge.
- Power BI forums
- Galleries
- COVID-19 Data Stories Gallery
- #COVID Dashboard
#COVID Dashboard
03-30-2020 08:25 AM - last edited 04-16-2020 08:59 AM


- Mark as New
- Bookmark
- Subscribe
- Mute
- Subscribe to RSS Feed
- Permalink
- Report Inappropriate Content
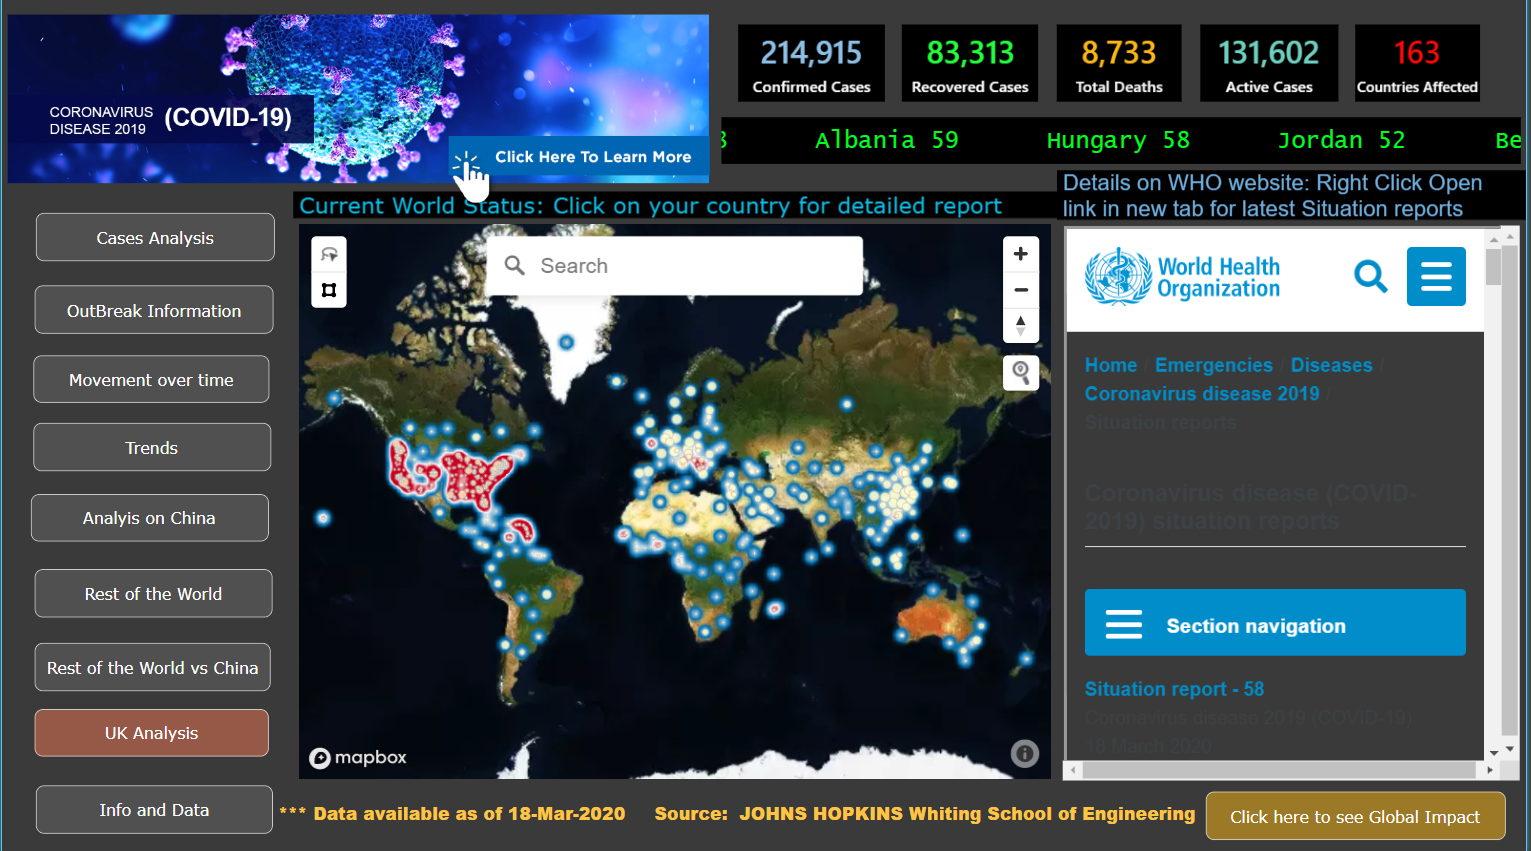
#COVID Dashboard
This dashboard has been created to track down outbreak of CoronaVirus.
Data is T-1 and is directly taken live from JOHN HOPKINS Whiting school of Engineering. This dashboard is live and will be refreshed daily.
Following are the things extensively covered.
1) Confirmed cases
2) Recovered (recovered %)
3) Active
4) Deaths
5) Death Ratio
A outbreak animated analysis has been done via Heatmaps and GeoLocation maps to cover all the states/provinces affected across the world. A detailed analysis on China along with trends, comparison of it vs the world, Rest of the world analysis is also available.
Datasources used were taken from Gituhb repository of Johns Hopkins School of Engineering.
https://github.com/CSSEGISandData/COVID-19
Hope it helps a lot of users to visualize data.
Update15th March 2020: Added 2 new tabs:
Movement over time: Scatter chart with Confirmed, Active and Deaths by Country & Date
Flow Chart: How the spread moved from different countries since inception.
Update 17th March 2020:
Added a Global Impact page (button available from home page) with some images showing effect of COVID across world economy on restaurants, stock markets, Flight bookings, car sales, gold trading etc. & many more
Update 18th March 2020:
Added a Play Axis timeline to animate Trends: Page: Movement overtime >> Click for Animated Trendline
Added a new visual on home page embedding who website.
Update 19th March 2020:
Realtime COVID-19 Analysis on India is now available.
Data directly fetched from Ministry of Health and Family Welfare: https://www.mohfw.gov.in
It also contains all the helpline numbers for all states and Union territories. :https://lnkd.in/fU-yG_d
Further adding it also contains details of Hospital Beds: Data fetched fromhttps://lnkd.in/f-rCG4c
Added separate Analysis for United Kingdom showing breakup of Cases as per each location.
Same analysis done for India.
Update 15th April..
New v2 version has been published with a lot of new features. Continentwise breakup, Country split Daily cases, trends, Maps (Icon Maps), US, Italy, India, UK analysis available. Entire look and feel has been changed from v1.
eyJrIjoiMjJhNGE1ZWYtNjAyOC00MTk1LWIyMTUtYjIzNGE0NjhlNzAyIiwidCI6IjgwNGZhNDQzLTVlZGItNDNiMS1hZmUzLWY5NGE2MGVkNjUzZSJ9