Get Fabric or SQL Certified for Free.
Get certified for free when you join Fabric Data Days 2026 and dive into Fabric, Power BI, SQL, AI, and other essential data skills.
Join now- Power BI forums
- Get Help with Power BI
- Desktop
- Service
- Report Server
- Power Query
- Mobile Apps
- Developer
- DAX Commands and Tips
- Custom Visuals Development Discussion
- Health and Life Sciences
- Power BI Spanish forums
- Translated Spanish Desktop
- Training and Consulting
- Instructor Led Training
- Dashboard in a Day for Women, by Women
- Galleries
- Data Stories Gallery
- Themes Gallery
- Contests Gallery
- QuickViz Gallery
- Quick Measures Gallery
- Visual Calculations Gallery
- Notebook Gallery
- Translytical Task Flow Gallery
- TMDL Gallery
- R Script Showcase
- Webinars and Video Gallery
- Ideas
- Custom Visuals Ideas (read-only)
- Issues
- Issues
- Events
- Upcoming Events
Try your skills in the Power BI Dataviz World Championship! Round one ends June 26. Join now
- Power BI forums
- Galleries
- Themes Gallery
- Spring (CSG Pro)
Your file has been submitted successfully. We’re processing it now - please check back in a few minutes to view your report.


- Mark as New
- Bookmark
- Subscribe
- Mute
- Subscribe to RSS Feed
- Permalink
- Report Inappropriate Content
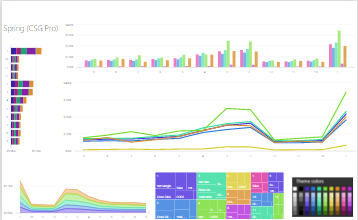
Spring (CSG Pro)
Allowing for a full 8 visually distinct color catagories while being aesthetically pleasing; this theme ellicits the warm colors of spring.
If you have 8 measures or a common 8 categories you want to encode to specific colors this is an excellent choice.
Red is not included as it is left to be a reserved color used for either very-bad or very-good signifying based on the culture the report is presented it. (Including it would draw undue attention to whichever category came up as red; a shade of pink is used instead). This red value: DC2C2F matches the other colors for both Saturation and Brightness and can be used to keep aesthetic consistancy wthin the report.
The default colors are high saturation and work great for thin stroked (thin) line chart. Wide stroked (thick) bar charts or especially tree maps should use the lighter variation of each color found below the base colors at the top of the color picker.
For very small bars/line, or when focus needs to be drawn to a specific chart/chart-element the darker tones in the color picker can be used to strong effect.
Colors have a Saturation Value of ~80 and Brightness Value of ~86.
(Getting the number of distinct colors here to be so large lead to this palate is not color blind safe)
eyJrIjoiOTZlNDE3ZjgtOTNkNi00YmMxLWE5NWQtNTYwYWRlN2I4NGIyIiwidCI6IjBhY2U5YjBiLWVmYWUtNDMwNC04MTBhLTE0MTdiYmQxZDBkNiIsImMiOjZ9
- Mark as New
- Bookmark
- Subscribe
- Mute
- Subscribe to RSS Feed
- Permalink
- Report Inappropriate Content
Apologies for the duplicate post, if a mod could delete this version, that would be excellent. Much thanks!