Join us at the 2025 Microsoft Fabric Community Conference
March 31 - April 2, 2025, in Las Vegas, Nevada. Use code MSCUST for a $150 discount! Early bird discount ends December 31.
Register Now- Power BI forums
- Get Help with Power BI
- Desktop
- Service
- Report Server
- Power Query
- Mobile Apps
- Developer
- DAX Commands and Tips
- Custom Visuals Development Discussion
- Health and Life Sciences
- Power BI Spanish forums
- Translated Spanish Desktop
- Training and Consulting
- Instructor Led Training
- Dashboard in a Day for Women, by Women
- Galleries
- Community Connections & How-To Videos
- COVID-19 Data Stories Gallery
- Themes Gallery
- Data Stories Gallery
- R Script Showcase
- Webinars and Video Gallery
- Quick Measures Gallery
- 2021 MSBizAppsSummit Gallery
- 2020 MSBizAppsSummit Gallery
- 2019 MSBizAppsSummit Gallery
- Events
- Ideas
- Custom Visuals Ideas
- Issues
- Issues
- Events
- Upcoming Events
Be one of the first to start using Fabric Databases. View on-demand sessions with database experts and the Microsoft product team to learn just how easy it is to get started. Watch now
- Power BI forums
- Galleries
- Themes Gallery
- Re: Revenue | Summary


- Mark as New
- Bookmark
- Subscribe
- Mute
- Subscribe to RSS Feed
- Permalink
- Report Inappropriate Content
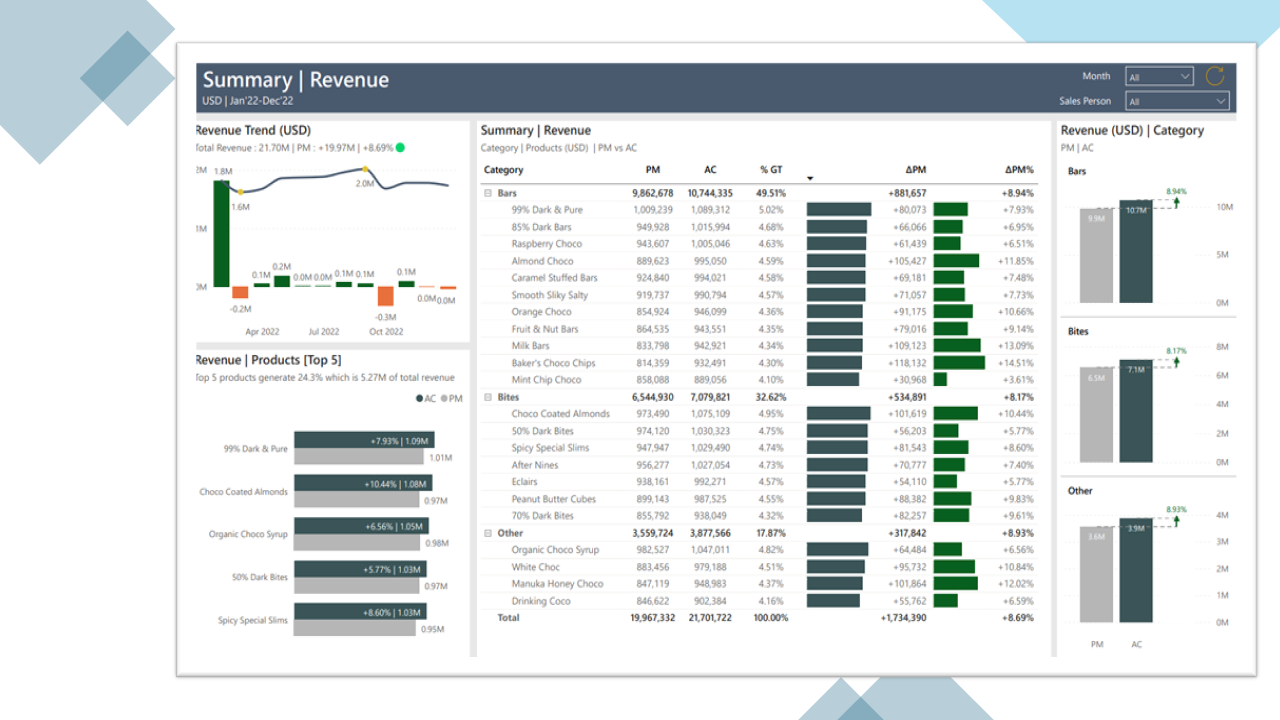
Revenue | Summary
Revenue | Summary
Build a Revenue Summary Report, Which shows the comparison of revenue and variance in month label.
I have used the error bar which depicts the variance of the product category.
form a native visual of Powerbi.
Thanks,
eyJrIjoiNTY5ZGI2ZjMtZTg4YS00NjRhLWExM2YtODQ4MWQ4ZDYyNzRiIiwidCI6ImQ4ZTFiMDVlLTcwYWEtNGVmNy1iODc4LTQ2NmI2ODhmOTUyZiJ9
- Mark as New
- Bookmark
- Subscribe
- Mute
- Subscribe to RSS Feed
- Permalink
- Report Inappropriate Content
Can you please share the pbix file. meenasa10@hotmail.com
- Mark as New
- Bookmark
- Subscribe
- Mute
- Subscribe to RSS Feed
- Permalink
- Report Inappropriate Content
Please share the pbix file. meenasa10@hotmail.com
- Mark as New
- Bookmark
- Subscribe
- Mute
- Subscribe to RSS Feed
- Permalink
- Report Inappropriate Content
Great work.
Please share pbix file romon.ft@gmail.com
- Mark as New
- Bookmark
- Subscribe
- Mute
- Subscribe to RSS Feed
- Permalink
- Report Inappropriate Content
Can you share the pbix? please
blsamia939@gmail.com
- Mark as New
- Bookmark
- Subscribe
- Mute
- Subscribe to RSS Feed
- Permalink
- Report Inappropriate Content
Can you please share the pbix? please
lissherrera15@gmail.com
- Mark as New
- Bookmark
- Subscribe
- Mute
- Subscribe to RSS Feed
- Permalink
- Report Inappropriate Content
Great looking report. The Theme file download appears to be empty though. All I'm getting is
{"name":"Custom","visualStyles":{"*":{"*":{"outspacePane":[{"transparency":1}]}}}}- Mark as New
- Bookmark
- Subscribe
- Mute
- Subscribe to RSS Feed
- Permalink
- Report Inappropriate Content
Really good way to represent the data. I would apriciate if you could send me the pbix
rene.molina2026@gmail.com