FabCon is coming to Atlanta
Join us at FabCon Atlanta from March 16 - 20, 2026, for the ultimate Fabric, Power BI, AI and SQL community-led event. Save $200 with code FABCOMM.
Register now!- Power BI forums
- Get Help with Power BI
- Desktop
- Service
- Report Server
- Power Query
- Mobile Apps
- Developer
- DAX Commands and Tips
- Custom Visuals Development Discussion
- Health and Life Sciences
- Power BI Spanish forums
- Translated Spanish Desktop
- Training and Consulting
- Instructor Led Training
- Dashboard in a Day for Women, by Women
- Galleries
- Data Stories Gallery
- Themes Gallery
- Contests Gallery
- QuickViz Gallery
- Quick Measures Gallery
- Visual Calculations Gallery
- Notebook Gallery
- Translytical Task Flow Gallery
- TMDL Gallery
- R Script Showcase
- Webinars and Video Gallery
- Ideas
- Custom Visuals Ideas (read-only)
- Issues
- Issues
- Events
- Upcoming Events
The Power BI Data Visualization World Championships is back! Get ahead of the game and start preparing now! Learn more
- Power BI forums
- Galleries
- R Script Showcase
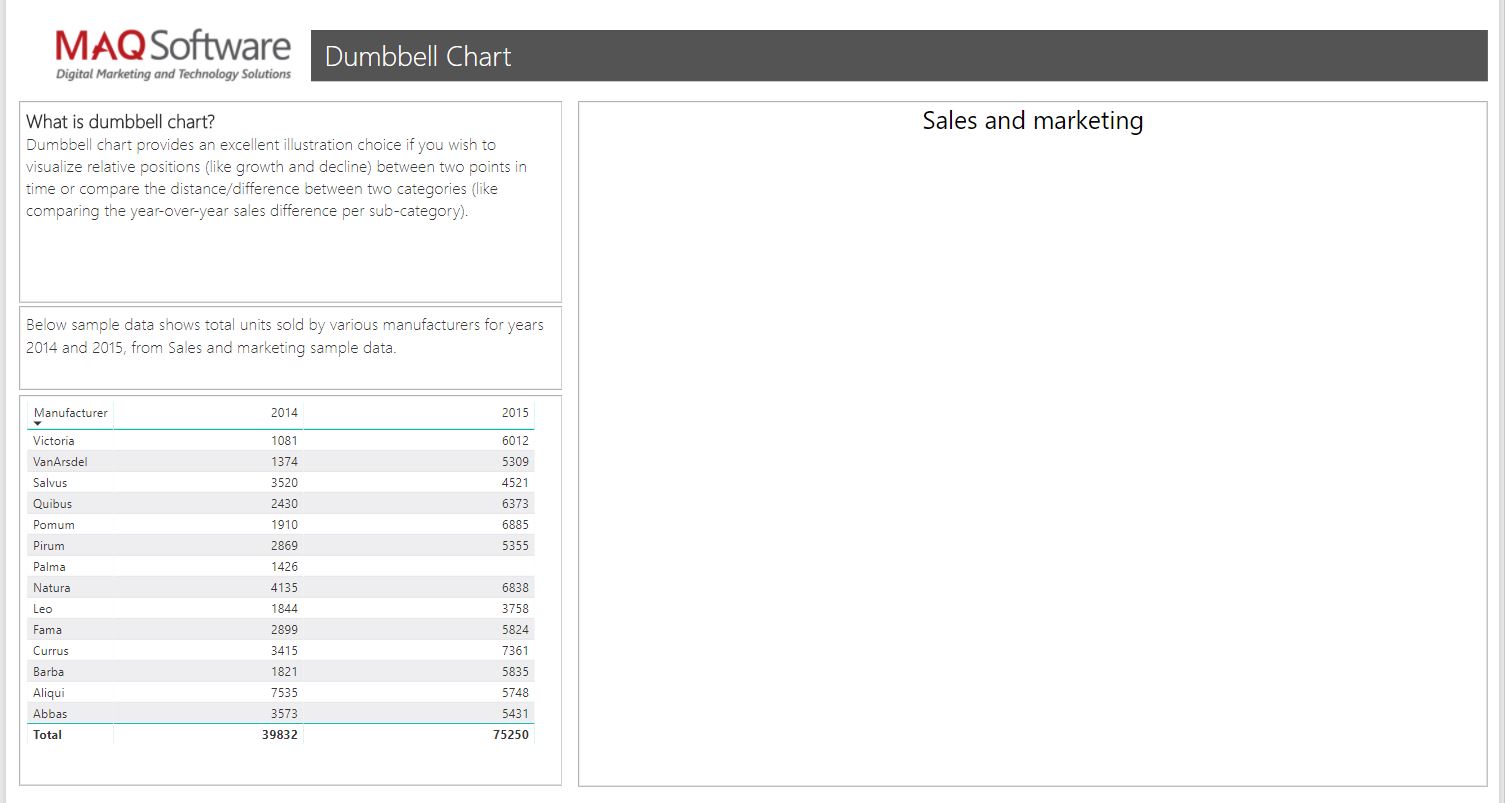
- Dumbbell Chart by MAQ Software
Your file has been submitted successfully. We’re processing it now - please check back in a few minutes to view your report.


- Mark as New
- Bookmark
- Subscribe
- Mute
- Subscribe to RSS Feed
- Permalink
- Report Inappropriate Content
Dumbbell Chart by MAQ Software
- Mark as New
- Bookmark
- Subscribe
- Mute
- Subscribe to RSS Feed
- Permalink
- Report Inappropriate Content
Hello @MAQSupport, just wondering if the ability to format chart (size, axis) was ever developed for this? Thanks!
- Mark as New
- Bookmark
- Subscribe
- Mute
- Subscribe to RSS Feed
- Permalink
- Report Inappropriate Content
- Mark as New
- Bookmark
- Subscribe
- Mute
- Subscribe to RSS Feed
- Permalink
- Report Inappropriate Content
Hello @Anonymous,
We recommend you to update to the latest version of Power BI desktop (October 2018) and test the report.
Let us know if this resolves your issue.
Thanks.
- Mark as New
- Bookmark
- Subscribe
- Mute
- Subscribe to RSS Feed
- Permalink
- Report Inappropriate Content
Hi @MAQSupport,
It works for me now after update to Oct version. Thanks.
It does look really good. I love it. However, it doesn't seem to show all of my data (i.e. no vertical scrollbar) and I can't sort it. Also, I think it would be really useful if there is an option to show in logarithmic scale.
Looking forward to seeing more enhancement.
Cheers,
- Mark as New
- Bookmark
- Subscribe
- Mute
- Subscribe to RSS Feed
- Permalink
- Report Inappropriate Content
Hello @Anonymous ,
Dumbbell Chart by MAQ Software supports only 300 rows and so if your dataset contains rows greater than 300, visual will render only the top 300 rows.
For logarithmic scale, we have added your request to backlog and we will notify you on this thread when we update the visual with the enhancements.
Thanks.
- Mark as New
- Bookmark
- Subscribe
- Mute
- Subscribe to RSS Feed
- Permalink
- Report Inappropriate Content
it would be immensely helpful to have the ability to format in this chart
thickness of line
size of dumbbells
axis spacing (so category names can fit if over the current size limit)
- Mark as New
- Bookmark
- Subscribe
- Mute
- Subscribe to RSS Feed
- Permalink
- Report Inappropriate Content
Hello @dedmondson,
We have added your request to our backlog.
We will update you on this thread when we add these features as enhacements in the upcoming versions of this visual.
Thanks.
- Mark as New
- Bookmark
- Subscribe
- Mute
- Subscribe to RSS Feed
- Permalink
- Report Inappropriate Content
Is the visual available for use in other PowerBI books? Real question is, "Is the visual available in the store?"
Great work BTW.
Steve
- Mark as New
- Bookmark
- Subscribe
- Mute
- Subscribe to RSS Feed
- Permalink
- Report Inappropriate Content
Hello @SteveYoungca,
Greetings.
The visual is now available on AppSource.
Please visit and download the same.
Continue to rate our visuals and kindly provide your feedback on the visuals published by MAQ Software.
Thanks
- Mark as New
- Bookmark
- Subscribe
- Mute
- Subscribe to RSS Feed
- Permalink
- Report Inappropriate Content
Awesome, thanks for the reply. I appreciate the great work you do. !!!