Join us at FabCon Vienna from September 15-18, 2025
The ultimate Fabric, Power BI, SQL, and AI community-led learning event. Save €200 with code FABCOMM.
Get registered- Power BI forums
- Get Help with Power BI
- Desktop
- Service
- Report Server
- Power Query
- Mobile Apps
- Developer
- DAX Commands and Tips
- Custom Visuals Development Discussion
- Health and Life Sciences
- Power BI Spanish forums
- Translated Spanish Desktop
- Training and Consulting
- Instructor Led Training
- Dashboard in a Day for Women, by Women
- Galleries
- Data Stories Gallery
- Themes Gallery
- Contests Gallery
- Quick Measures Gallery
- Notebook Gallery
- Translytical Task Flow Gallery
- TMDL Gallery
- R Script Showcase
- Webinars and Video Gallery
- Ideas
- Custom Visuals Ideas (read-only)
- Issues
- Issues
- Events
- Upcoming Events
Compete to become Power BI Data Viz World Champion! First round ends August 18th. Get started.
- Power BI forums
- Galleries
- Quick Measures Gallery
- Concatenated Tooltip


- Mark as New
- Bookmark
- Subscribe
- Mute
- Subscribe to RSS Feed
- Permalink
- Report Inappropriate Content
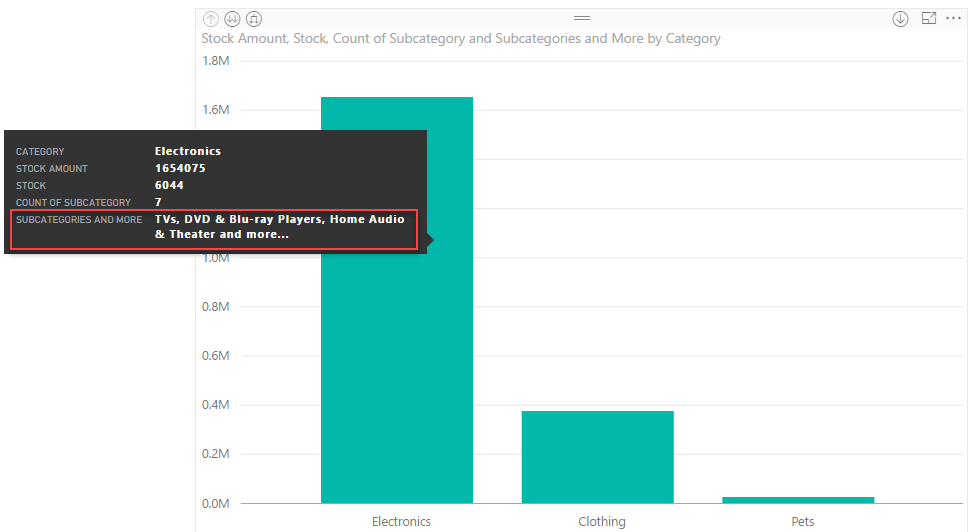
Concatenated Tooltip
Concatenated Tooltip
This quick measure allows you to enhance your visual's tooltip, allowing you to display a list of values in a comma separated list.
Subcategories and More =
VAR SubcategoriesCount = DISTINCTCOUNT('Stock'[Subcategory])
RETURN
IF(SubcategoriesCount>=3,
Calculate(CONCATENATEX(TOPN(3, VALUES('Stock'[Subcategory])), 'Stock'[Subcategory], ", "))&" and more...",
CALCULATE(CONCATENATEX(VALUES(Stock[Subcategory]), 'Stock'[Subcategory],", "))
)
eyJrIjoiOTNkY2Y1MmQtY2Y0Ni00MGY1LTkzYTItMzBlNDIxZTVkMzhiIiwidCI6IjBhYTVjODNjLTkzZjMtNGY0ZC1hNzJmLTdiZTkzMDkxOTZhNiIsImMiOjN9
- Mark as New
- Bookmark
- Subscribe
- Mute
- Subscribe to RSS Feed
- Permalink
- Report Inappropriate Content
Or like Rob Collie showed...
like this
[Selected]:=
IF(NOT(ISFILTERED(Products[Subcategory])),”All”,
IF(COUNTROWS(ALLSELECTED(Products[Subcategory]))>5, “> 5 Subcategories”,
CONCATENATEX(
ALLSELECTED(Products[Subcategory]),
Products[Subcategory],
“, ”
)
)
)
- Mark as New
- Bookmark
- Subscribe
- Mute
- Subscribe to RSS Feed
- Permalink
- Report Inappropriate Content
Hi Wouter. Interesting... Is there an added benefit of doing it this way. Seems more complex than it needs to be but maybe there's a benefit I'm not immediately seeing.