Fabric Data Days starts November 4th!
Advance your Data & AI career with 50 days of live learning, dataviz contests, hands-on challenges, study groups & certifications and more!
Get registered- Power BI forums
- Get Help with Power BI
- Desktop
- Service
- Report Server
- Power Query
- Mobile Apps
- Developer
- DAX Commands and Tips
- Custom Visuals Development Discussion
- Health and Life Sciences
- Power BI Spanish forums
- Translated Spanish Desktop
- Training and Consulting
- Instructor Led Training
- Dashboard in a Day for Women, by Women
- Galleries
- Data Stories Gallery
- Themes Gallery
- Contests Gallery
- QuickViz Gallery
- Quick Measures Gallery
- Visual Calculations Gallery
- Notebook Gallery
- Translytical Task Flow Gallery
- TMDL Gallery
- R Script Showcase
- Webinars and Video Gallery
- Ideas
- Custom Visuals Ideas (read-only)
- Issues
- Issues
- Events
- Upcoming Events
Get Fabric Certified for FREE during Fabric Data Days. Don't miss your chance! Request now
- Power BI forums
- Forums
- Get Help with Power BI
- Power Query
- Transform date into month and year format
- Subscribe to RSS Feed
- Mark Topic as New
- Mark Topic as Read
- Float this Topic for Current User
- Bookmark
- Subscribe
- Printer Friendly Page
- Mark as New
- Bookmark
- Subscribe
- Mute
- Subscribe to RSS Feed
- Permalink
- Report Inappropriate Content
Transform date into month and year format
Hi All,
i need to know, how Transform date into month and year format in excel query
Solved! Go to Solution.
- Mark as New
- Bookmark
- Subscribe
- Mute
- Subscribe to RSS Feed
- Permalink
- Report Inappropriate Content
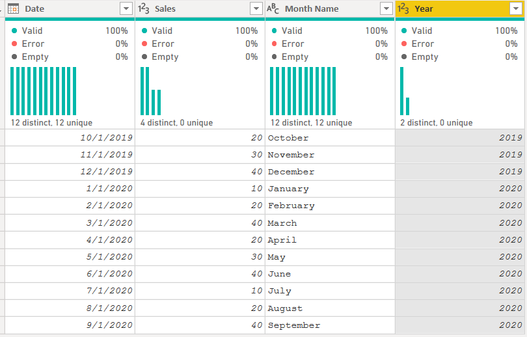
@Anonymous Do you want seperate column for Month and Year in your data, you can do this using below lines in power query
#"Inserted Month Name" = Table.AddColumn(#"Changed Type", "Month Name", each Date.MonthName([Date]), type text),
#"Inserted Year" = Table.AddColumn(#"Inserted Month Name", "Year", each Date.Year([Date]), Int64.Type)
Your output will be like below
Did I answer your question? Mark my post as a solution!
Appreciate your Kudos
Proud to be a Super User!
Follow me on linkedin
- Mark as New
- Bookmark
- Subscribe
- Mute
- Subscribe to RSS Feed
- Permalink
- Report Inappropriate Content
- Mark as New
- Bookmark
- Subscribe
- Mute
- Subscribe to RSS Feed
- Permalink
- Report Inappropriate Content
@Anonymous Do you want seperate column for Month and Year in your data, you can do this using below lines in power query
#"Inserted Month Name" = Table.AddColumn(#"Changed Type", "Month Name", each Date.MonthName([Date]), type text),
#"Inserted Year" = Table.AddColumn(#"Inserted Month Name", "Year", each Date.Year([Date]), Int64.Type)
Your output will be like below
Did I answer your question? Mark my post as a solution!
Appreciate your Kudos
Proud to be a Super User!
Follow me on linkedin
- Mark as New
- Bookmark
- Subscribe
- Mute
- Subscribe to RSS Feed
- Permalink
- Report Inappropriate Content
@Anonymous
Instead of creating those columns in Power Query, do it in the Data Model.
Go to your table, add a new column for Year Month Sorting:
YearMonthSort = YEAR([DATE]) * 100 + MONTH([DATE])
Add the Year Month column to use in visuals
Year Month = FORMAT([DATE],"MMM YYYY")
Now select the Year Month Column and got the Column Tools tab and sort by YearMonthSort column, Done
________________________
If my answer was helpful, please consider Accept it as the solution to help the other members find it
Click on the Thumbs-Up icon if you like this reply 🙂
⭕ Subscribe and learn Power BI from these videos
⚪ Website ⚪ LinkedIn ⚪ PBI User Group
Helpful resources

Fabric Data Days
Advance your Data & AI career with 50 days of live learning, contests, hands-on challenges, study groups & certifications and more!

Power BI Monthly Update - October 2025
Check out the October 2025 Power BI update to learn about new features.


