Register now to learn Fabric in free live sessions led by the best Microsoft experts. From Apr 16 to May 9, in English and Spanish.
- Synapse forums
- Forums
- Get Help with Synapse
- General Discussion
- Re: Performance difference between default semanti...
- Subscribe to RSS Feed
- Mark Topic as New
- Mark Topic as Read
- Float this Topic for Current User
- Bookmark
- Subscribe
- Printer Friendly Page
- Mark as New
- Bookmark
- Subscribe
- Mute
- Subscribe to RSS Feed
- Permalink
- Report Inappropriate Content
Performance difference between default semantic model and custom (new) semantic model?
Hi,
Is there a difference in performance between using the Lakehouse's default semantic model, or creating a new direct lake semantic model (also known as custom semantic model)?
Ref. this blog: "The Default dataset is also performance optimized. I have seen in some cases, default dataset perform faster in cold cache compared to custom dataset. I am not sure why."
Thank you!
- Mark as New
- Bookmark
- Subscribe
- Mute
- Subscribe to RSS Feed
- Permalink
- Report Inappropriate Content
Thank you @AndyDDC,
I agree with you.
I don't understand why there would be a difference. Which factors are affecting semantic model performance?
Both semantic models (default and custom) will use the same Lakehouse delta files.
And we are assuming that both semantic models are in cold state.
I assume both default and custom semantic model have auto-refresh enabled for the delta table metadata.
Are there any optimizations one can do in the semantic model? Adding relationships between tables in the model will create keys which will give faster queries I guess (?), but I assume both models have the same relationships.
Do you have suggestion about which application to use for testing semantic model performance?
I am most familiar with DAX Studio for performance testing. However the Server Timings functionality in DAX Studio doesn't work for the default semantic model (although it works fine for custom semantic models).
My background is Power BI / data analyst. However I could try to utilize some data engineering tools, if required.
Thank you 😀 Highly appreciate your sharing in the community, it's always a good read!
- Mark as New
- Bookmark
- Subscribe
- Mute
- Subscribe to RSS Feed
- Permalink
- Report Inappropriate Content
Adding relationships in the Warehouse can certainly help performance as although unique and foreign keys are not actually enforced, they help the query optimiser. With Lakehouses I have not noticed any performance differences if I create relationships in the semantic model, but of course the only reason to join tables is to propagate filters anyway.
Well I think Chris Webbs blog is pretty good,but it may not cover the default semantic model. Maybe we can reach out to MS to clarify about server timings (I will do that) https://blog.crossjoin.co.uk/2023/07/09/performance-testing-power-bi-direct-lake-mode-datasets-in-fa...
if you do any perf testing then please let us all know how that goes, the more info we can collate together the better
- Mark as New
- Bookmark
- Subscribe
- Mute
- Subscribe to RSS Feed
- Permalink
- Report Inappropriate Content
It would be interesting if you get clarification from MS about the possibility to get server timings for the default semantic model (and also, if there is any information on whether default and custom semantic models are equal or not with regards to performance).
I tried to do some performance testing with Performance Analyzer in Power BI desktop, connected live to Direct Lake semantic model in Power BI service (Fabric). So far I have struggled to be able to clear the cache on the default semantic model. There is no refresh button on the default semantic model in Power BI service, so I'm not able to clear the cache.
For the custom semantic model, I think I can clear the cache by clicking the refresh button on the semantic model, or by using DAX studio to clear the cache.
I don't know what is the purpose of the default semantic model... I think it's a bit weird that editing the default semantic model is not possible when you click on the semantic model itself in the workspace, instead you need to go to the Lakehouse SQL endpoint to edit the default semantic model. The custom semantic models are more intuitive with regards to the editing interface IMO, and they also work with DAX studio. So I don't know why the default semantic model exists...
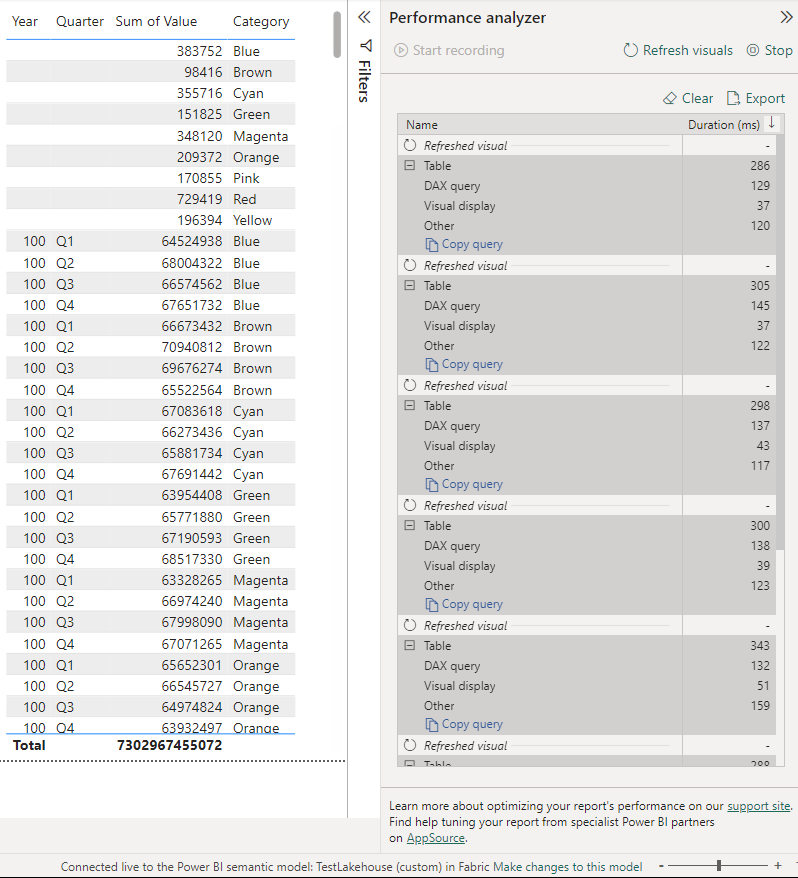
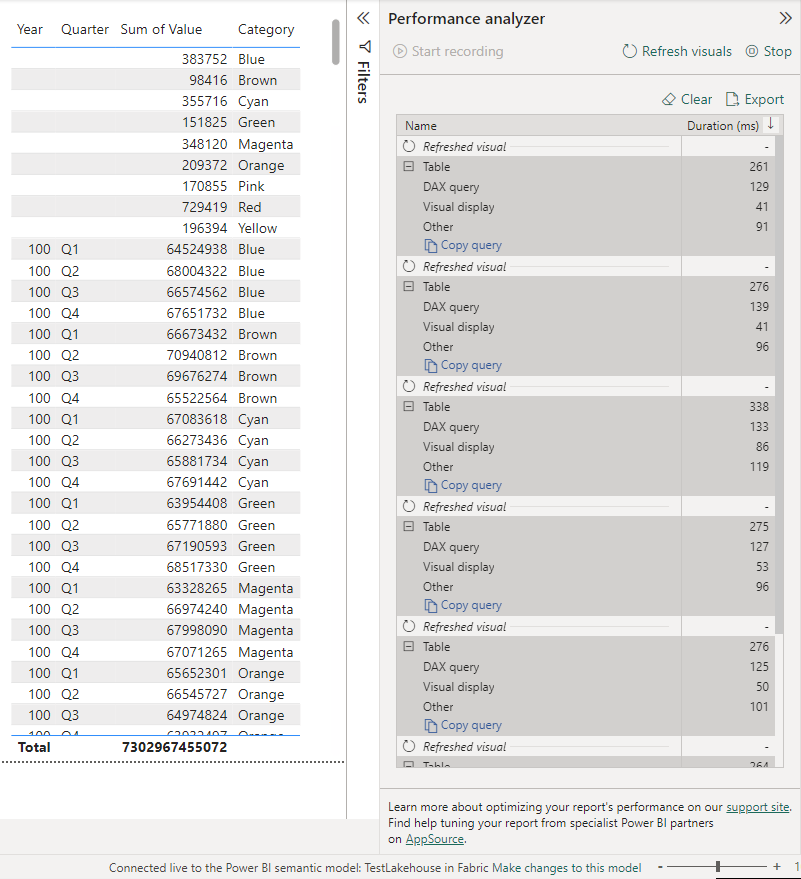
I did some hot performance tests, using a simple Fact table of 200 million rows which has a datekey relationship to a Dim calendar with 1 million rows (also, there are some fact rows which don't have a match in the dim table).
The DAX query times seem to be very similar for the default and custom semantic model (in hot state, at least).
Custom semantic model:
Default semantic model:
- Mark as New
- Bookmark
- Subscribe
- Mute
- Subscribe to RSS Feed
- Permalink
- Report Inappropriate Content
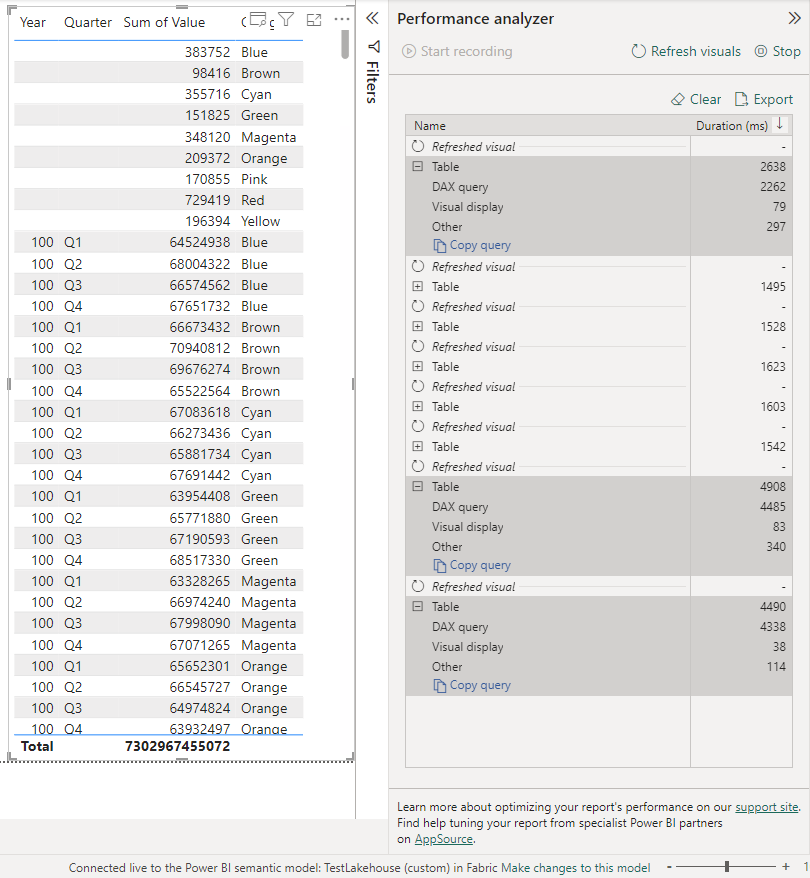
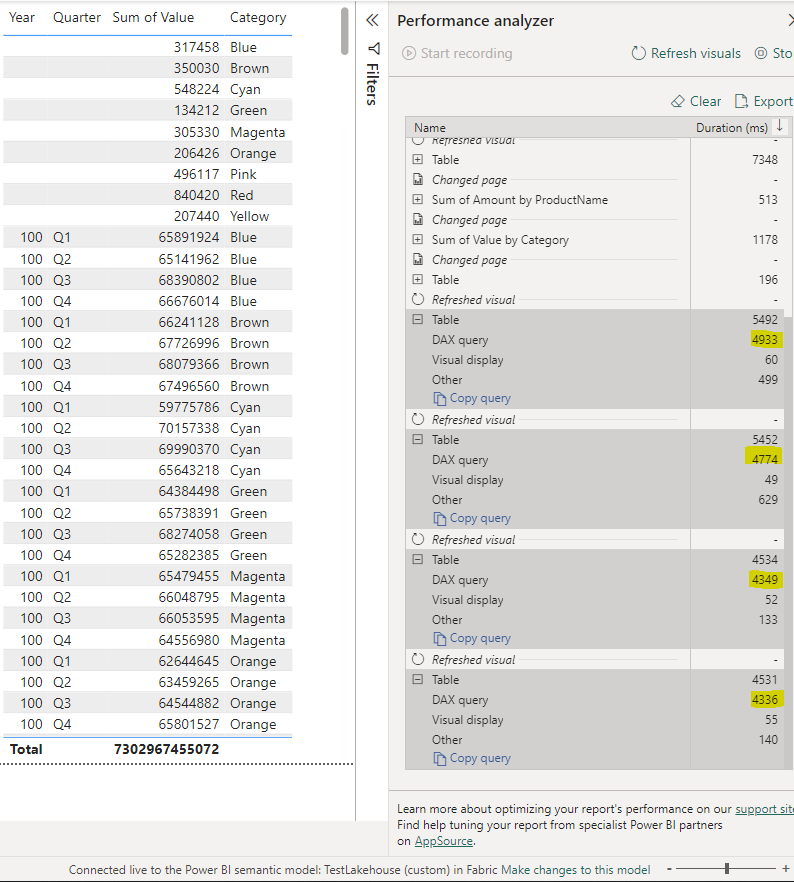
I also tried to clear the cache on the Custom semantic model.
I thought I could do this via DAX studio, or by refreshing the custom semantic model in Power BI service, however I am a little confused by the results I got.
The ones with duration < 2500 ms were run after I used DAX studio to clear the cache on the direct lake semantic model in the Fabric workspace.
The ones with duration > 4000 ms were run after I used the refresh semantic model button in the Fabric workspace in Power BI service.
It seems that DAX studio is not able to fully clear the cache on the direct lake semantic models. At least the query times are slower after I refresh the semantic model in Fabric (Power BI service).
- Mark as New
- Bookmark
- Subscribe
- Mute
- Subscribe to RSS Feed
- Permalink
- Report Inappropriate Content
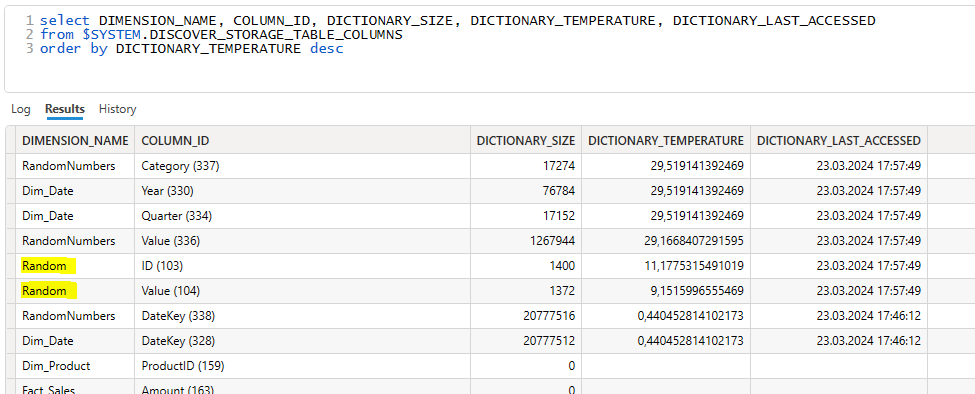
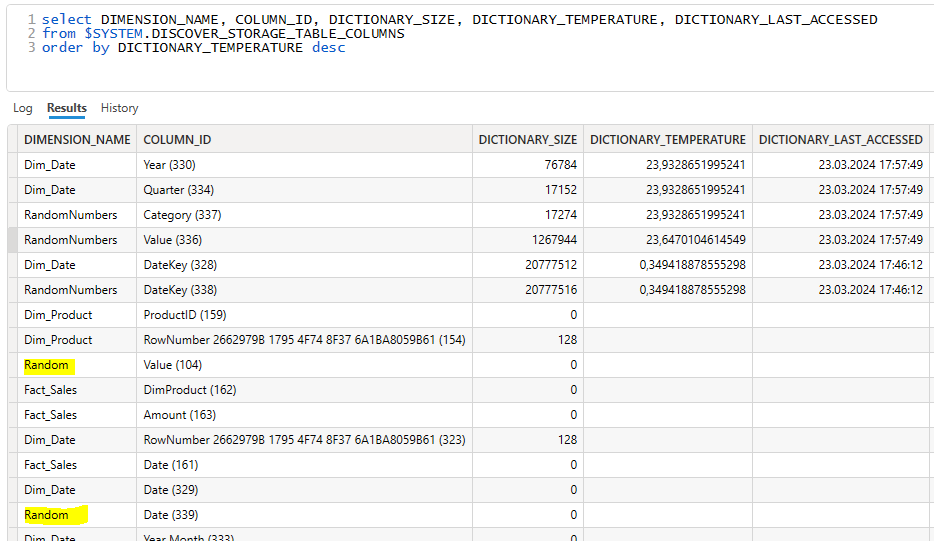
I realized I can get information about the current temperature of the data columns.
I tried running the following DMV query in DAX studio. I got it from this great blog:
select DIMENSION_NAME, COLUMN_ID, DICTIONARY_SIZE, DICTIONARY_TEMPERATURE, DICTIONARY_LAST_ACCESSED
from $SYSTEM.DISCOVER_STORAGE_TABLE_COLUMNS
order by DICTIONARY_TEMPERATURE desc
I get an error message if I try running this query on the default semantic model.
However I can run the query on the custom semantic model:
My observation is that it seems like only columns in the table for which I updated the data, gets 0 temperature (gets evicted from cache).
Before I update data in the Random table:
Right after I updated data in the Random table:
(I used dataflow gen2 to update the data in the Random table. The semantic model has auto-refresh enabled, so the semantic model's delta table metadata gets updated when data changes.)
When I click the refresh button on the custom semantic model, all the columns get 0 temperature:
- Mark as New
- Bookmark
- Subscribe
- Mute
- Subscribe to RSS Feed
- Permalink
- Report Inappropriate Content
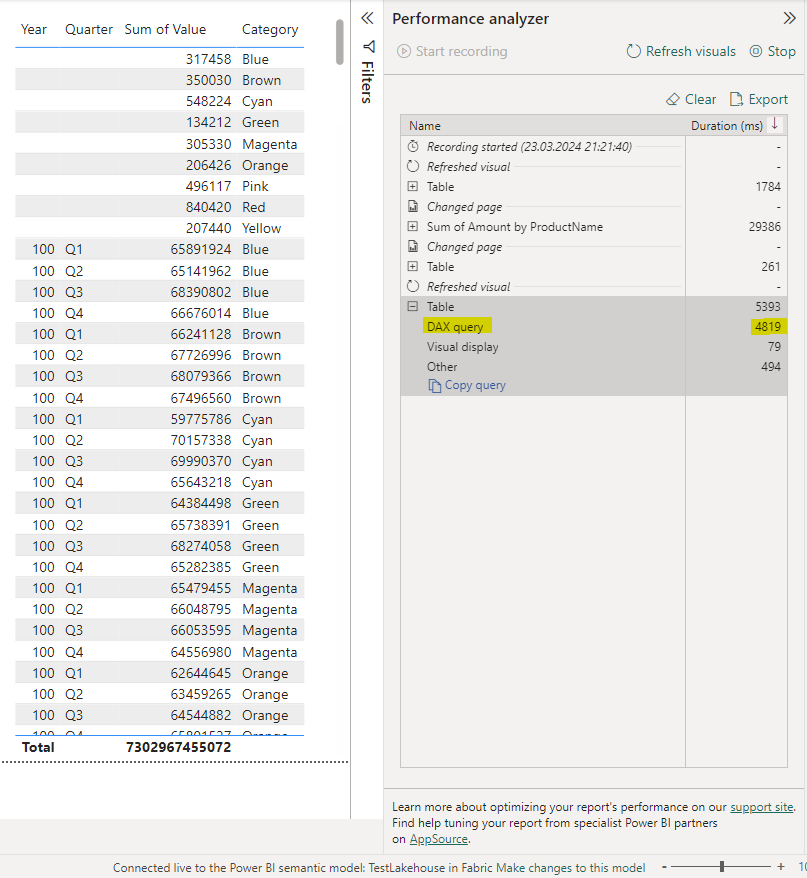
I believe I managed to query the default semantic model in cold state now.
First, I updated (replaced) the data in all the Lakehouse tables included in the semantic model, this should set the temperature of all columns to zero.
I also let the semantic model stay unused overnight, for good measure.
Then I refreshed the visual in my report. Now I got a DAX query duration of 4819 ms for the default semantic model. This is quite similar to the durations I got for the cold state custom semantic model yesterday.
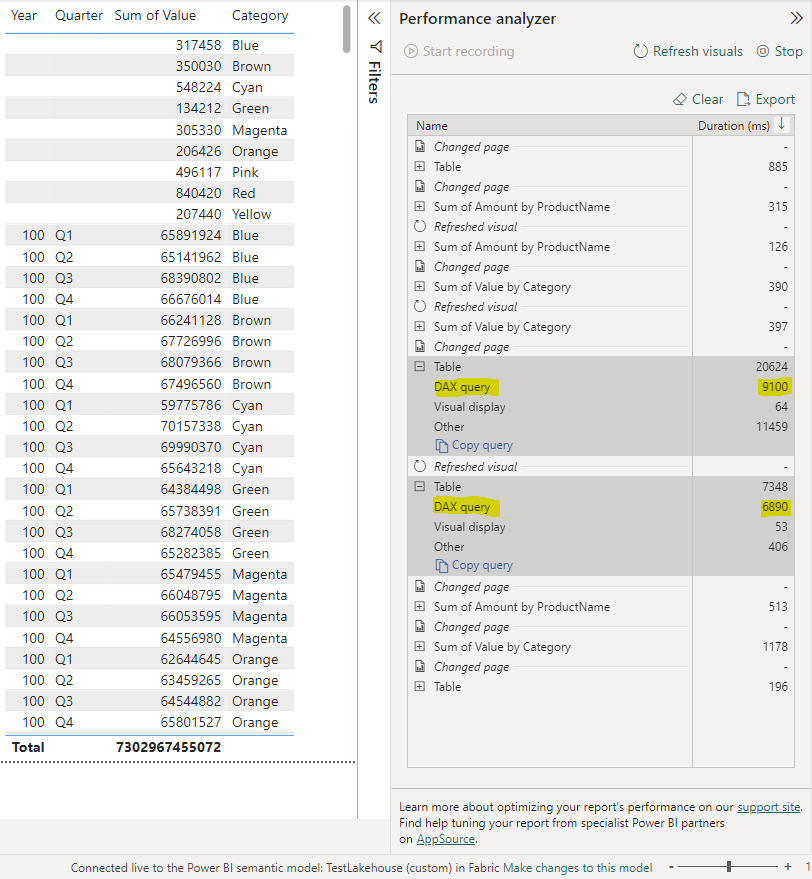
However, I also tried refreshing the visual in the report which is connected to the custom semantic model. Then, at first attempt, I got a DAX query time of 9100 ms (new all-time-high!). Yesterday, I had disabled the auto-refresh on the custom semantic model. So it had stayed unused, and not refreshed, for approx. 10 hours. Still, I'm surprised that the Performance Analyzer showed a DAX query duration which is around 100% longer than yesterday.
I then manually refreshed the custom semantic model in Power BI service (Fabric workspace). Then I refreshed the visual again, and the DAX query time was now 6890 ms. Still around 50% longer than the measurements I got yesterday.
Then, I repeated this procedure (refresh the custom semantic model, then refresh the visual) several times. During these runs, the durations I got was similar to the durations I got yesterday.
Maybe the Fabric capacity just needed to "warm up" before it was able to produce similar DAX query durations like yesterday?
I guess my key findings at this point are:
- Updating data in a single table in the semantic model, seems to only evict the columns from that table from cache (column temperature gets zero). Columns from other tables in the semantic table, still have high temperature. This is great for the end-user experience, as high column temperatures means visuals render more quickly 😀
- I prefer the custom semantic model over the default semantic model, because
- it allows server timings in DAX studio
- it allows column temperatures to be reviewed by using DMVs
- it allows manual refresh (and scheduled refresh)
- the modeling experience of the custom semantic model is found inside the semantic model item itself (which is intuitive)
- I disfavor the default semantic model, because
- it seems to have limited functionalities compared to the custom semantic model
- the modeling experience of the default semantic model is unintuitively placed in the SQL analytics endpoint, and not in the semantic model item itself
- I want to remove the default semantic model from the workspace, but I don't think it's possible
- I don't understand the purpose of the default semantic model
- It's difficult to compare the cold state performance of the default semantic model vs. the custom semantic model, because I cannot manually refresh the default semantic model.
Any corrections or additions are greatly appreciated 😀
- Mark as New
- Bookmark
- Subscribe
- Mute
- Subscribe to RSS Feed
- Permalink
- Report Inappropriate Content
Hello @frithjof_v ,
We haven’t heard from you on the last response and was just checking back to see if you have a resolution yet .
In case if you have any resolution please do share that same with the community as it can be helpful to others .
Otherwise, will respond back with the more details and we will try to help .
- Mark as New
- Bookmark
- Subscribe
- Mute
- Subscribe to RSS Feed
- Permalink
- Report Inappropriate Content
Hi @frithjof_v ,
We just want to check back to see if you have a resolution yet .
In case if you have any resolution please do share that same with the community as it can be helpful to others .
Otherwise, will respond back with the more details and we will try to help .
- Mark as New
- Bookmark
- Subscribe
- Mute
- Subscribe to RSS Feed
- Permalink
- Report Inappropriate Content
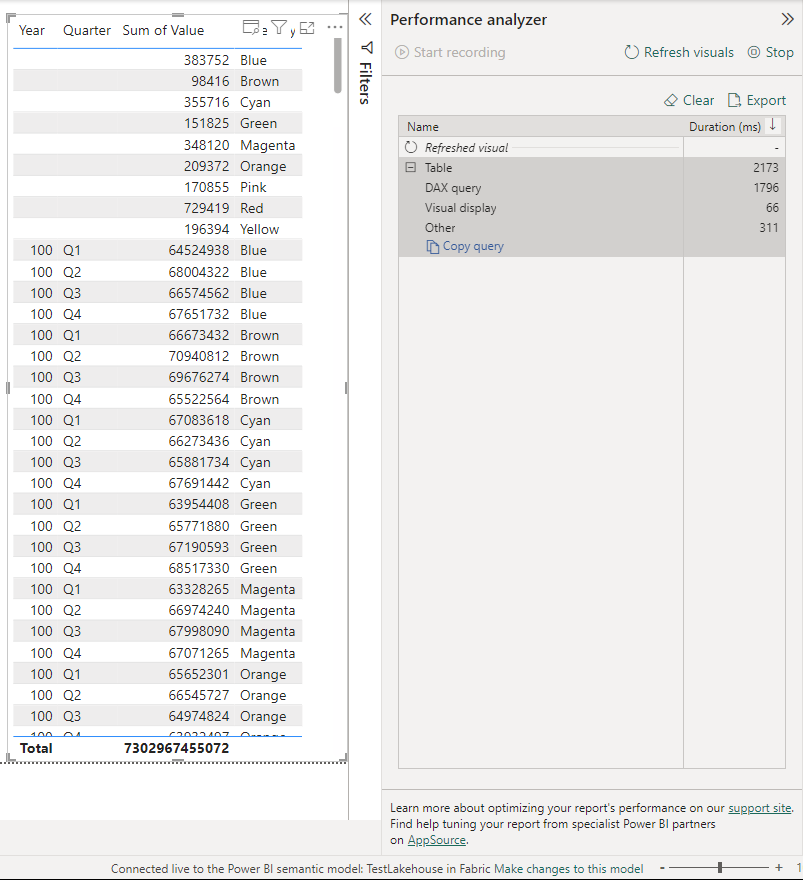
I used a dataflow gen2 to update the data in another table in the default semantic model, in an attempt to get the default semantic model to refresh.
(Would this refresh the default semantic model? The refresh history on the default semantic model is still blank afterwards).
After doing that, the default semantic model did indeed take more time to run the query, but shorter time than the custom semantic model did after refreshing the custom semantic model.
I also repeated those steps one more time after I took this screenshot: update data in another table in the default semantic model and run the query again, and then I got approximately the same result again (DAX query duration 1859 ms this time).
If this is indeed the default semantic model in cold state, then it is 2x faster than the custom semantic model in cold state.
But I'm not sure if the default semantic model is 100% cold after I update the data in one table which is in the default semantic model?
- Mark as New
- Bookmark
- Subscribe
- Mute
- Subscribe to RSS Feed
- Permalink
- Report Inappropriate Content
Hi @frithjof_v I can't imagine why the default semantic model would perform better in cold cache tests vs a custom semantic model. Sandeep (fabric guru blog) has conducted a lot of tests with direct lake to form that FAQ, so I would say do your own testing as well to see if you get the same results with your data.
Helpful resources

Fabric Monthly Update - April 2024
Check out the April 2024 Fabric update to learn about new features.

Microsoft Fabric Learn Together
Covering the world! 9:00-10:30 AM Sydney, 4:00-5:30 PM CET (Paris/Berlin), 7:00-8:30 PM Mexico City

| User | Count |
|---|---|
| 10 | |
| 10 | |
| 8 | |
| 5 | |
| 4 |
