Join us at FabCon Vienna from September 15-18, 2025
The ultimate Fabric, Power BI, SQL, and AI community-led learning event. Save €200 with code FABCOMM.
Get registered- Power BI forums
- Get Help with Power BI
- Desktop
- Service
- Report Server
- Power Query
- Mobile Apps
- Developer
- DAX Commands and Tips
- Custom Visuals Development Discussion
- Health and Life Sciences
- Power BI Spanish forums
- Translated Spanish Desktop
- Training and Consulting
- Instructor Led Training
- Dashboard in a Day for Women, by Women
- Galleries
- Data Stories Gallery
- Themes Gallery
- Contests Gallery
- Quick Measures Gallery
- Notebook Gallery
- Translytical Task Flow Gallery
- TMDL Gallery
- R Script Showcase
- Webinars and Video Gallery
- Ideas
- Custom Visuals Ideas (read-only)
- Issues
- Issues
- Events
- Upcoming Events
Enhance your career with this limited time 50% discount on Fabric and Power BI exams. Ends September 15. Request your voucher.
- Power BI forums
- Forums
- Get Help with Power BI
- Developer
- one pbix in one workspace but the ability to have ...
- Subscribe to RSS Feed
- Mark Topic as New
- Mark Topic as Read
- Float this Topic for Current User
- Bookmark
- Subscribe
- Printer Friendly Page
- Mark as New
- Bookmark
- Subscribe
- Mute
- Subscribe to RSS Feed
- Permalink
- Report Inappropriate Content
one pbix in one workspace but the ability to have different color scheme based on user
Hello,
I have the following question. Is it somehow possible to have one pbix report in one workspace but based on the user that logs in they will see another color scheme or other logo.
to explain:
we are building a report based on customerdata and advisor companies get acces to that data. so we have a general report with lots of keyfigures. We have more than 10 organizations that want that report (with their own color scheme and logo) but we don't want 10 workspaces and change 10 reports if something needs to be fixed.
so I was wondering if somehow we could have 1 report in 1 workspace but we can change the theme/ colorscheme / organisation logo based on a user login..
Solved! Go to Solution.
- Mark as New
- Bookmark
- Subscribe
- Mute
- Subscribe to RSS Feed
- Permalink
- Report Inappropriate Content
Hi @Karola
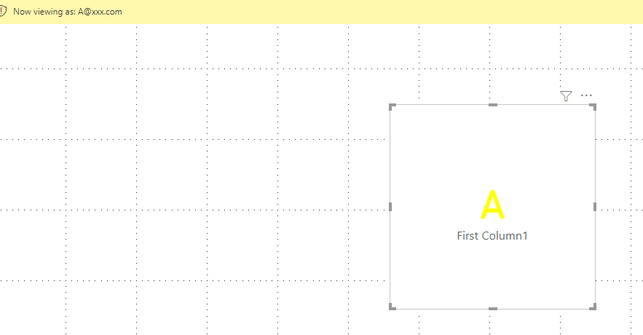
You need to build a measure and add this measure into you visual to change your color dynamically.
Measure = SWITCH(USERPRINCIPALNAME() ,"A@xxx.com","Yellow","B@xxx.com","Blue","Black")
If you want to restirct data access by user, you can try to create RLS in your data source.
For reference: Implement row-level security in an on-premises Analysis Services tabular model
Best Regards,
Rico Zhou
If this post helps, then please consider Accept it as the solution to help the other members find it more quickly.
- Mark as New
- Bookmark
- Subscribe
- Mute
- Subscribe to RSS Feed
- Permalink
- Report Inappropriate Content
@lbendlin We use live connection so that would not be a problem. except, when you do it like you said you still have work when you change a design or add new pages etc.
- Mark as New
- Bookmark
- Subscribe
- Mute
- Subscribe to RSS Feed
- Permalink
- Report Inappropriate Content
Hi @Karola
You need to build a measure and add this measure into you visual to change your color dynamically.
Measure = SWITCH(USERPRINCIPALNAME() ,"A@xxx.com","Yellow","B@xxx.com","Blue","Black")
If you want to restirct data access by user, you can try to create RLS in your data source.
For reference: Implement row-level security in an on-premises Analysis Services tabular model
Best Regards,
Rico Zhou
If this post helps, then please consider Accept it as the solution to help the other members find it more quickly.
- Mark as New
- Bookmark
- Subscribe
- Mute
- Subscribe to RSS Feed
- Permalink
- Report Inappropriate Content
You create one master dataset (often called the "golden" dataset) in one workspace, and then you create independent reports in other workspaces, all with their own layout and color scheme, but all consuming the same golden dataset.


