This is best Fabric, Power BI, SQL and AI community event. How do we know? The last event sold out! Save €200 with code FABCMTY200.
Register nowA new Data Days event is coming soon! This time we’re going bigger than ever. Fabric, Power BI, SQL, AI and more. Don't miss out.
Hi,
Anyone else has this problem?
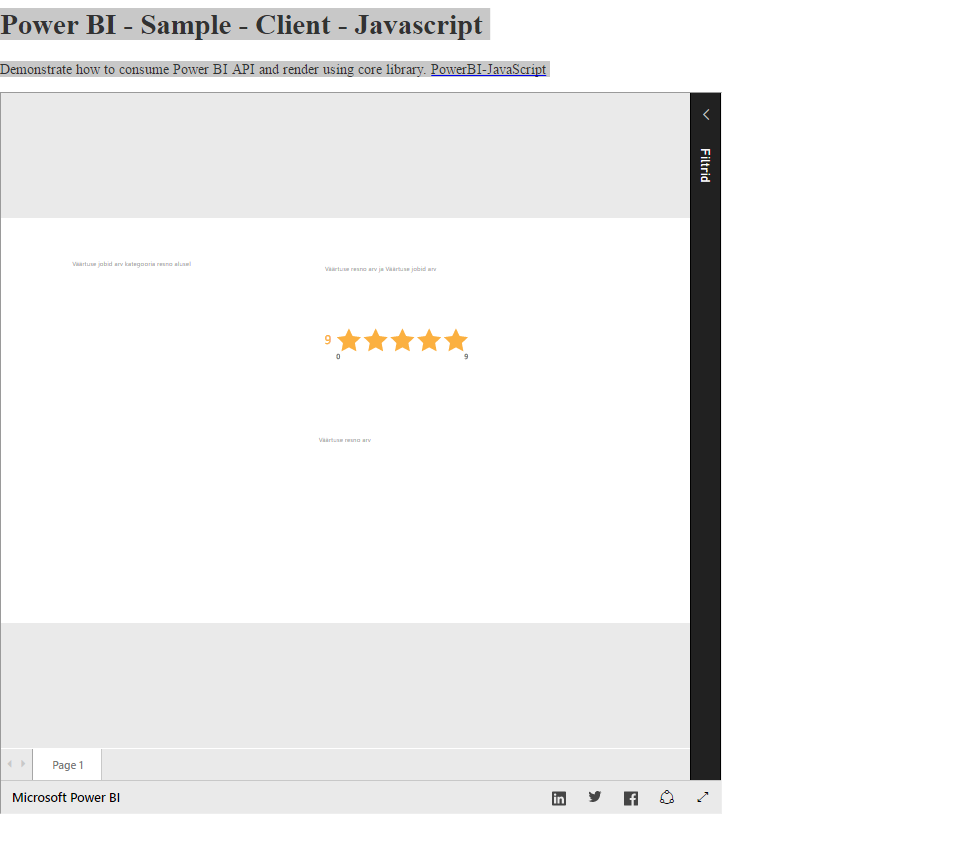
Seems that custom visuals are not loaded properly in iframe.
When using builtin visual then then problem does not occure (bar chart etc.)
Basically all u see, is visual title
Any ideas guys ?
Is there any error message in your Web Console? Share us more detailed information if possible.
Hi
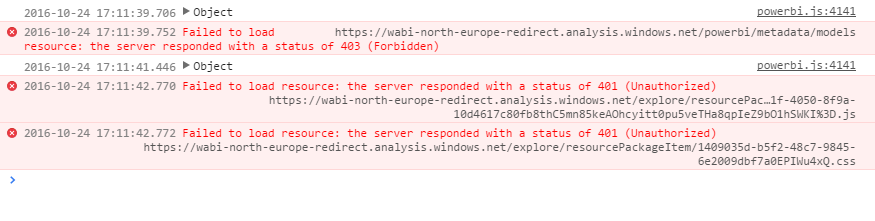
Tere are some errors but they are not related to this issue i think.
These error appear even when i am not using any custom visuals.
These are the errors.
What has been changed since your previous post? Share the corresponding code segment as well if possible.
No need to add any code.
This happens with original javascript demo code also, just use custom visuals on a report(add more then one custom visuals)
i copied code from this demo
I see an issue has been submitted at https://github.com/Microsoft/PowerBI-JavaScript/issues/76. You may share here as well if any update.
visuals i tried with :
Liquid Fill Gauge, Stars
Check out the May 2026 Power BI update to learn about new features.
Sign up to receive a private message when registration opens and key events begin.
If you have recently started exploring Fabric, we'd love to hear how it's going. Your feedback can help with product improvements.
| User | Count |
|---|---|
| 2 | |
| 1 | |
| 1 | |
| 1 | |
| 1 |