Hi guys
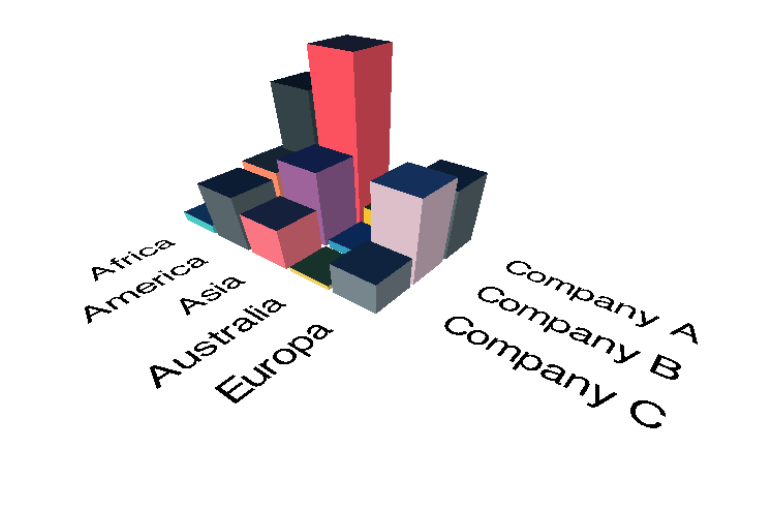
I am trying to get a 3D bar chart to work as a custom visual. The data it should draw are two categorical (X and Y) variables to get the grid of the chart as well as a numerical value (Z) to define the height of the bars, like so:
The visual compiles fine without any errors but when I am trying to display it in Power BI Service only an empty visual is returned:
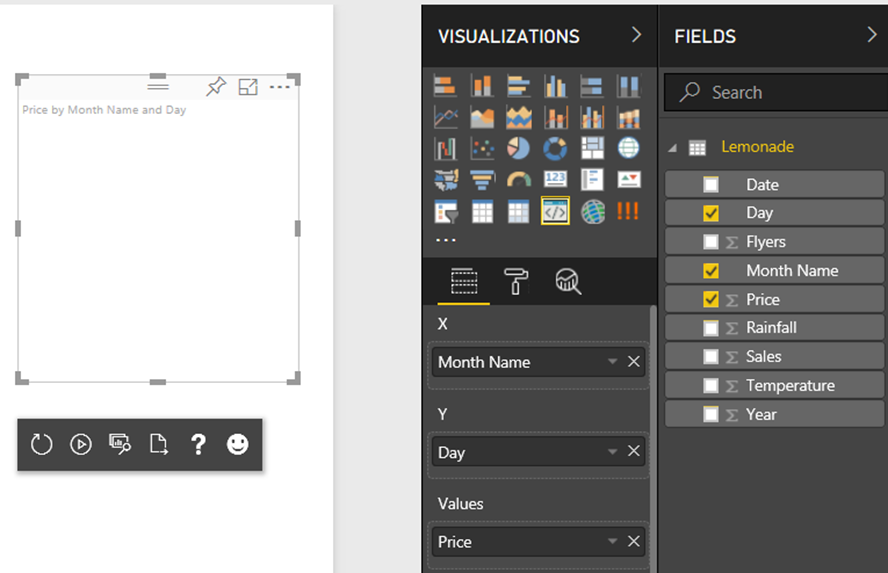
I think the problem might be somewhere in data bindung such as that the visual doesn't draw the data that is selected in PBI.
However, I am not able to locate the problem.
When I try to package the visual, the following error appears:

I am grateful for any help, thanks!
The visual code is here


