Get certified for free when you join Fabric Data Days 2026 and dive into Fabric, Power BI, SQL, AI, and other essential data skills.
Join nowJuly 7 - July 17 | Round 2 of the Power BI Dataviz World Championships. Don't miss your chance! Learn more
I'm attempting to build a custom connector for a cube data source. I'd like to model the navigation behaviors like the Adobe Analytics Connector that is available. In the example video, it showed a navigator that allowed the users to select both measures and dimensions for the query before applying and generating data. Is there any documentation or references that show how that behavior is achievable? So far in the navigation table samples, only tables and functions are covered.
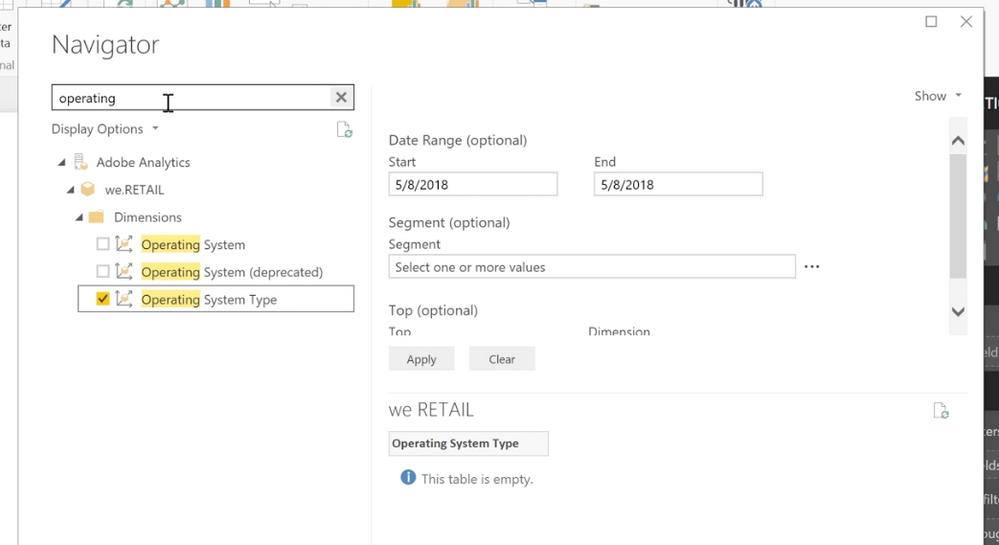
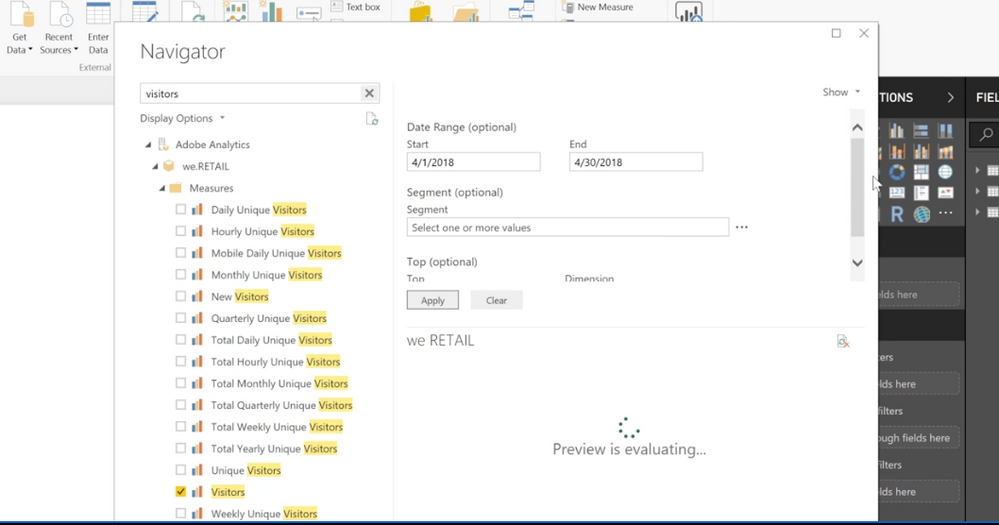
I've attached screenshots from the example below showing the dimension and measure selection workflow
Thanks!
Hi @rohong ,
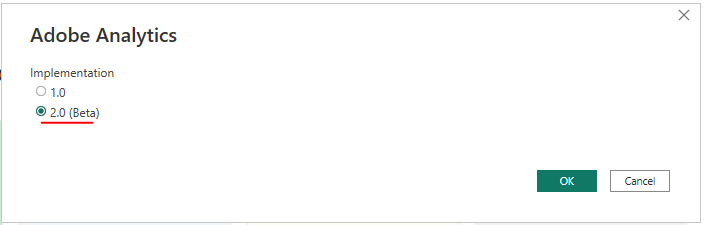
If I understand correctly, you are trying to connect to Adobe Analytics. And you can't find Dimensions and Measures in the navigator. First, please make sure those info exist in Adobe Analytics source exactly. Then which version of Adobe Analytics API you selected in below screenshot? Please select the latest one: 2.0...
If the above one still not working, you can consider to raise one ticket in Adobe Analytics community due to this connector refer a third-party service.
Adobe Analytics Dimensions and Measures missing in Power BI
In addition, you can refer the following links to create a custom connector...
Power BI Custom Connector: Connect to Any Data Sources. Hello World! - RADACAD
Custom Data Connector: How to Deploy and Test
video: Create custom connectors in Power Bi
Best Regards
Hi Rena,
I'm not looking to connect to Adobe Analytics. I want to develop a custom connector that presents a Navigator view that looks like the one in the screenshots. I was using it as a UI reference. I'm looking to understand the Power Query M definitions that would let me build the right table and types. Currently, the documentation does not have much information beyond simple tables and functions, no cubes, measures, or dimensions.
Thanks!
Have you found a solution or example how to create something like this?
Join us in Barcelona for FabCon and SQLCon, the Fabric, Power BI, SQL, and AI community event. Save €200 with code FABCMTY200.
Join Data Days 2026: 60 days of free live/on-demand sessions, challenges, study groups, and certification opportunities.
| User | Count |
|---|---|
| 2 | |
| 1 | |
| 1 | |
| 1 | |
| 1 |
| User | Count |
|---|---|
| 4 | |
| 3 | |
| 2 | |
| 2 | |
| 2 |