This time we’re going bigger than ever. Fabric, Power BI, SQL, AI and more. We're covering it all. You won't want to miss it.
Learn moreLevel up your Power BI skills this month - build one visual each week and tell better stories with data! Get started
Hi Team,
Need help in solving the below problem.
We need to take the running sum of future 3 month data based on the month.
| Date | Data | |
| 1/1/2019 | 10 | |
| 1/5/2019 | 20 | |
| 1/7/2019 | 30 | |
| 2/2/2019 | 5 | |
| 2/15/2019 | 45 | |
| 2/25/2019 | 47 | |
| 3/1/2019 | 50 | |
| 3/6/2019 | 20 | |
| 3/27/2019 | 45 | |
| 4/4/2019 | 65 | |
| 4/25/2019 | 35 | |
| 4/29/2019 | 25 | |
| 5/1/2019 | 65 | |
| 5/10/2019 | 40 | |
| 6/15/2019 | 54 | |
| 7/25/2019 | 25 | |
| 8/24/2019 | 36 | |
| output | Data | Comment |
| Jan-19 | 337 | Running sum of Feb,march ,April |
| Feb-19 | 345 | running sum of march,april,may |
| Mar-19 | 284 | Running sum of April ,may ,june |
| Apr-19 | 184 | Running sum of May ,June, July
|
Thanks,
Raj
Solved! Go to Solution.
You will need a Calendar table if you dont have one already. Make sure it has a Year, MonthName, MonthNumber ( to sort month name) column.
Related that to yoru main table on Date (1:M) and make sure to put columns from the Calendar tables as filters ( rows, columns, ect).
Then you can write these two measures:
Total of Data = SUM ( Table2[Data] )
Total of Next 3 Months =
CALCULATE(
[Total of Data],
DATESBETWEEN(
DimCalendar[Date],
LASTDATE(DimCalendar[Date]),
DATEADD(
LASTDATE(DimCalendar[Date]),3,MONTH)
)
)And here's the final table:
You will need a Calendar table if you dont have one already. Make sure it has a Year, MonthName, MonthNumber ( to sort month name) column.
Related that to yoru main table on Date (1:M) and make sure to put columns from the Calendar tables as filters ( rows, columns, ect).
Then you can write these two measures:
Total of Data = SUM ( Table2[Data] )
Total of Next 3 Months =
CALCULATE(
[Total of Data],
DATESBETWEEN(
DimCalendar[Date],
LASTDATE(DimCalendar[Date]),
DATEADD(
LASTDATE(DimCalendar[Date]),3,MONTH)
)
)And here's the final table:
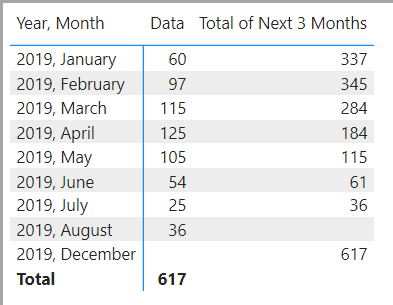
Hi I used the same data and formula from above. Here is what I come up with:
I don't understand why Dec-19 has 617 as the next 3 months total. Can you please help? Thank you!
Hi Nick,,
Can you send me the pbix file.
Thanks,
Raj
Sign up to receive a private message when registration opens and key events begin.
If you have recently started exploring Fabric, we'd love to hear how it's going. Your feedback can help with product improvements.
| User | Count |
|---|---|
| 31 | |
| 23 | |
| 22 | |
| 20 | |
| 15 |
| User | Count |
|---|---|
| 64 | |
| 41 | |
| 25 | |
| 22 | |
| 20 |