cancel
Showing results for 
Search instead for 
Did you mean: 

July 7 - July 17 | Round 2 of the Power BI Dataviz World Championships. Don't miss your chance! Learn more

Reply
Anonymous
Not applicable

performance optimisation for table visual

Hi team,

I need a help in improving the performance of a table visual that i have in my report. 


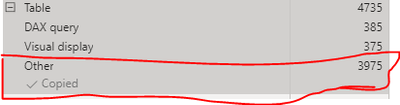
I dont have any measure or calculated column in the table.  Just 3 columns added in Values section of the visual.   But still it takes 3975 ms for rendering.  Anything do you suggest to improve this dax?


LPD280388_0-1618505056563.png


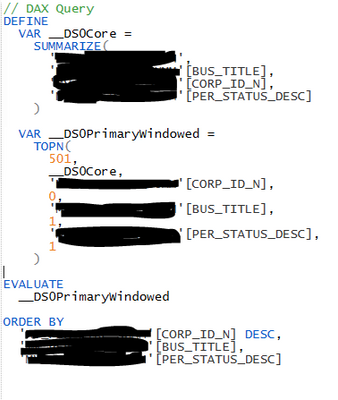
The Dax shows as below : 


LPD280388_1-1618505293319.png


1 ACCEPTED SOLUTION
aj1973
Community Champion
Community Champion

@Anonymous 

The process for the visuals to load is controled by Power Bi engine (Backend), you can't controle that nor priotirize one before the other. The user can only controle the performance of the DAX and the display of the visual. What the video is trying to present is how to normalise some visuals and to reduce the number of visuals inside one page. 

I would recommend to reduce some visuals from the first page and introduce Bookmarks and Drillthrough to call for the other visuals into other pages.

Here is an example of using buttons for Bookmarks and Drillthroughs

https://app.powerbi.com/view?r=eyJrIjoiMmFhYWVlMDUtYTk3My00Y2U2LTgwMWEtZDQwNjAyNmQwNjc5IiwidCI6IjgzN...


Regards
Amine Jerbi

If I answered your question, please mark this thread as accepted
and you can follow me on
My Website, LinkedIn and Facebook

View solution in original post

4 REPLIES 4
aj1973
Community Champion
Community Champion

Hi @Anonymous 

The good thing is that you don't have issues with DAX nor the visual. You have a consuming time in Other. Please watch this video to know what Other can refer to in your report. It could be time waiting for other visuals to execute.

https://www.youtube.com/watch?v=wNNemTpA9Vo


Regards
Amine Jerbi

If I answered your question, please mark this thread as accepted
and you can follow me on
My Website, LinkedIn and Facebook

Anonymous
Not applicable

@aj1973  Thanks for your response.   I did go through this video multiple times. But in my situation. I have few buttons and then 7 tables. in one of the table above attached is the Dax query gets generated when performance analyser is turned on.


How do i reduce the time that these tables run for and is there way to tell the powerbi to run a particular visual first among other visuals? 

aj1973
Community Champion
Community Champion

@Anonymous 

The process for the visuals to load is controled by Power Bi engine (Backend), you can't controle that nor priotirize one before the other. The user can only controle the performance of the DAX and the display of the visual. What the video is trying to present is how to normalise some visuals and to reduce the number of visuals inside one page. 

I would recommend to reduce some visuals from the first page and introduce Bookmarks and Drillthrough to call for the other visuals into other pages.

Here is an example of using buttons for Bookmarks and Drillthroughs

https://app.powerbi.com/view?r=eyJrIjoiMmFhYWVlMDUtYTk3My00Y2U2LTgwMWEtZDQwNjAyNmQwNjc5IiwidCI6IjgzN...


Regards
Amine Jerbi

If I answered your question, please mark this thread as accepted
and you can follow me on
My Website, LinkedIn and Facebook

Anonymous
Not applicable

@aj1973 Yes. Reducing the Visuals made a great impact on the performances. I had around 40 single card visuals and 2 multi row card which were brought down to 7 table visual which improved the performance.   thanks a lot for the reply.

Helpful resources

Announcements
FabCon and SQLCon Barcelona 2026

FabCon & SQLCon – Barcelona 2026

Join us in Barcelona for FabCon and SQLCon, the Fabric, Power BI, SQL, and AI community event. Save €200 with code FABCMTY200.

60 days of Data Days Carousel

Data Days 2026

Join Data Days 2026: 60 days of free live/on-demand sessions, challenges, study groups, and certification opportunities.

Power BI DataViz World Championships carousel

Power BI DataViz World Championships - June 2026

A new Power BI DataViz World Championship is coming this June! Don't miss out on submitting your entry.

Top Solution Authors