New Offer! Become a Certified Fabric Data Engineer
Check your eligibility for this 50% exam voucher offer and join us for free live learning sessions to get prepared for Exam DP-700.
Get Started- Power BI forums
- Get Help with Power BI
- Desktop
- Service
- Report Server
- Power Query
- Mobile Apps
- Developer
- DAX Commands and Tips
- Custom Visuals Development Discussion
- Health and Life Sciences
- Power BI Spanish forums
- Translated Spanish Desktop
- Training and Consulting
- Instructor Led Training
- Dashboard in a Day for Women, by Women
- Galleries
- Community Connections & How-To Videos
- COVID-19 Data Stories Gallery
- Themes Gallery
- Data Stories Gallery
- R Script Showcase
- Webinars and Video Gallery
- Quick Measures Gallery
- 2021 MSBizAppsSummit Gallery
- 2020 MSBizAppsSummit Gallery
- 2019 MSBizAppsSummit Gallery
- Events
- Ideas
- Custom Visuals Ideas
- Issues
- Issues
- Events
- Upcoming Events
Don't miss out! 2025 Microsoft Fabric Community Conference, March 31 - April 2, Las Vegas, Nevada. Use code MSCUST for a $150 discount. Prices go up February 11th. Register now.
- Power BI forums
- Forums
- Get Help with Power BI
- Desktop
- Re: how to generate a table to calculate the sum o...
- Subscribe to RSS Feed
- Mark Topic as New
- Mark Topic as Read
- Float this Topic for Current User
- Bookmark
- Subscribe
- Printer Friendly Page
- Mark as New
- Bookmark
- Subscribe
- Mute
- Subscribe to RSS Feed
- Permalink
- Report Inappropriate Content
how to generate a table to calculate the sum of the last 6 months?
for example I have a table
| name | month | Amount | |
| A | 2022-2 | 22 | |
| A | 2022-3 | 30 | |
| A | 2022-5 | 22 | |
| A | 2022-7 | 30 | |
| A | 2022-9 | 40 | |
| A | 2022-10 | 18 | |
| B | 2022-3 | 40 | |
| B | 2022-4 | 12 | |
| B | 2022-6 | 40 | |
| B | 2022-7 | 22 | |
| B | 2022-8 | 66 | |
| B | 2022-10 | 45 |
I want to generate a new table to calculate like this(today is Nov,so the last 6 month should be from 2022-5 to 2022-10)
| Name | last 6 month amount |
| A | 110 |
| B | 173 |
And the data should be refreshed as time goes by.
Can someone help?
Thanks.
Solved! Go to Solution.
- Mark as New
- Bookmark
- Subscribe
- Mute
- Subscribe to RSS Feed
- Permalink
- Report Inappropriate Content
Hi @yanzhao_LBS
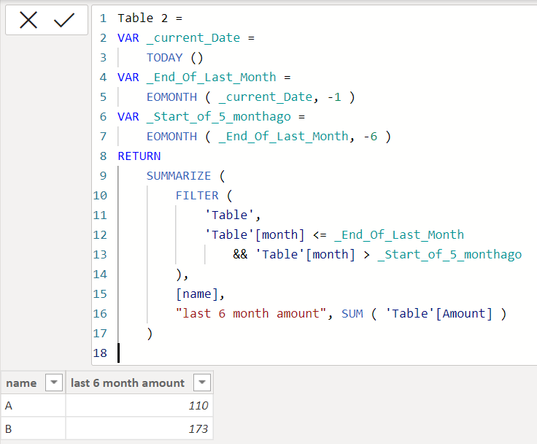
Try the following code to create your new table:
Table 2 =
VAR _current_Date =
    TODAY ()
VAR _End_Of_Last_Month =
    EOMONTH ( _current_Date, -1 )
VAR _Start_of_5_monthago =
    EOMONTH ( _End_Of_Last_Month, -6 )
RETURN
    SUMMARIZE (
        FILTER (
            'Table',
            'Table'[month] <= _End_Of_Last_Month
                && 'Table'[month] > _Start_of_5_monthago
        ),
        [name],
        "last 6 month amount", SUM ( 'Table'[Amount] )
    )
If this post helps, please consider accepting it as the solution to help the other members find it more quickly.
Appreciate your Kudos!!
- Mark as New
- Bookmark
- Subscribe
- Mute
- Subscribe to RSS Feed
- Permalink
- Report Inappropriate Content
Thanks for your help,it works perfectly
Helpful resources

Join us at the Microsoft Fabric Community Conference
March 31 - April 2, 2025, in Las Vegas, Nevada. Use code MSCUST for a $150 discount!

Power BI Monthly Update - January 2025
Check out the January 2025 Power BI update to learn about new features in Reporting, Modeling, and Data Connectivity.

| User | Count |
|---|---|
| 104 | |
| 69 | |
| 48 | |
| 41 | |
| 34 |
| User | Count |
|---|---|
| 164 | |
| 112 | |
| 62 | |
| 54 | |
| 38 |


