FabCon is coming to Atlanta
Join us at FabCon Atlanta from March 16 - 20, 2026, for the ultimate Fabric, Power BI, AI and SQL community-led event. Save $200 with code FABCOMM.
Register now!- Power BI forums
- Get Help with Power BI
- Desktop
- Service
- Report Server
- Power Query
- Mobile Apps
- Developer
- DAX Commands and Tips
- Custom Visuals Development Discussion
- Health and Life Sciences
- Power BI Spanish forums
- Translated Spanish Desktop
- Training and Consulting
- Instructor Led Training
- Dashboard in a Day for Women, by Women
- Galleries
- Data Stories Gallery
- Themes Gallery
- Contests Gallery
- QuickViz Gallery
- Quick Measures Gallery
- Visual Calculations Gallery
- Notebook Gallery
- Translytical Task Flow Gallery
- TMDL Gallery
- R Script Showcase
- Webinars and Video Gallery
- Ideas
- Custom Visuals Ideas (read-only)
- Issues
- Issues
- Events
- Upcoming Events
The Power BI Data Visualization World Championships is back! Get ahead of the game and start preparing now! Learn more
- Power BI forums
- Forums
- Get Help with Power BI
- Desktop
- date from filter
- Subscribe to RSS Feed
- Mark Topic as New
- Mark Topic as Read
- Float this Topic for Current User
- Bookmark
- Subscribe
- Printer Friendly Page
- Mark as New
- Bookmark
- Subscribe
- Mute
- Subscribe to RSS Feed
- Permalink
- Report Inappropriate Content
date from filter
HI guys
i have a formula in dax that i need add the last and the start date from the filter (date) in the report that the user defined, is possible this?
the filter in the report use "fecha correcta" but i need use the start and end date selection that the user define to pull the data from "fecha T"
thanks and regards
Solved! Go to Solution.
- Mark as New
- Bookmark
- Subscribe
- Mute
- Subscribe to RSS Feed
- Permalink
- Report Inappropriate Content
Hi @munder1978 ,
Here are the steps you can follow:
1. Create measure.
all_amount =
SUMX(ALL('Table'),'Table'[Precio])
min_Date =
MIN('Table'[Fecha Correcta])min_Date =
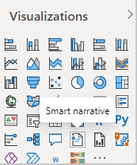
MIN('Table'[Fecha Correcta])2. Use Smart narrative visual objects.
3. In the dialog box that appears, write down the text first, and click +Value to find the corresponding measure
4. Result:
Best Regards,
Liu Yang
If this post helps, then please consider Accept it as the solution to help the other members find it more quickly
- Mark as New
- Bookmark
- Subscribe
- Mute
- Subscribe to RSS Feed
- Permalink
- Report Inappropriate Content
Hi @munder1978 ,
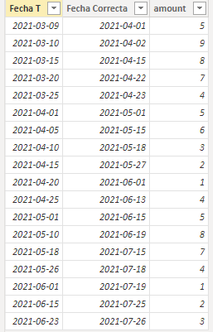
I created some data:
Here are the steps you can follow:
You can use [Fecha Correcta] as a slicer, select two values as the maximum and minimum.
Using the min() and max() functions to obtain the maximum and minimum values of the slicer.
1. Create measure.
Measure =
var _min=MIN('Table'[Fecha Correcta])
var _max=MAX('Table'[Fecha Correcta])
return
CALCULATE(SUM('Table'[amount]),FILTER(ALL('Table'),'Table'[Fecha T]>=_min&&'Table'[Fecha T]<=_max))
2. Result:
Best Regards,
Liu Yang
If this post helps, then please consider Accept it as the solution to help the other members find it more quickly
- Mark as New
- Bookmark
- Subscribe
- Mute
- Subscribe to RSS Feed
- Permalink
- Report Inappropriate Content
Hola Liu Yang
something like that is what I need but it does not give me the right value, create a more detailed vision to see if you can help me
Thanks a lot
- Mark as New
- Bookmark
- Subscribe
- Mute
- Subscribe to RSS Feed
- Permalink
- Report Inappropriate Content
@munder1978 , If you have joined a date table or use a filter/slicer from the same table it will filter automatically
else you need to create a measure and add it in visual. Do for all measures OR filter measure for non blank at visual level
measure =
var _max = maxx(allselected('Date'),'Date'[Date])
var _min = minx(allselected('Date'),'Date'[Date])
return
countrows(filter(Table, Table[Date]>=_min && Table[Date] <=_max))
- Mark as New
- Bookmark
- Subscribe
- Mute
- Subscribe to RSS Feed
- Permalink
- Report Inappropriate Content
Thanks amitchandack is work in a part, but i need to know the date min and max, and with this i have the number off day in period, for example if the user filter the report between 1-1-2021 and 2-2-2021, i need the mesure show me this 2 date like min and max and with that i can use in the formula.
thanks and reagards
Helpful resources

Power BI Monthly Update - November 2025
Check out the November 2025 Power BI update to learn about new features.

Fabric Data Days
Advance your Data & AI career with 50 days of live learning, contests, hands-on challenges, study groups & certifications and more!

| User | Count |
|---|---|
| 58 | |
| 45 | |
| 42 | |
| 21 | |
| 18 |


