FabCon is coming to Atlanta
Join us at FabCon Atlanta from March 16 - 20, 2026, for the ultimate Fabric, Power BI, AI and SQL community-led event. Save $200 with code FABCOMM.
Register now!- Power BI forums
- Get Help with Power BI
- Desktop
- Service
- Report Server
- Power Query
- Mobile Apps
- Developer
- DAX Commands and Tips
- Custom Visuals Development Discussion
- Health and Life Sciences
- Power BI Spanish forums
- Translated Spanish Desktop
- Training and Consulting
- Instructor Led Training
- Dashboard in a Day for Women, by Women
- Galleries
- Data Stories Gallery
- Themes Gallery
- Contests Gallery
- Quick Measures Gallery
- Notebook Gallery
- Translytical Task Flow Gallery
- TMDL Gallery
- R Script Showcase
- Webinars and Video Gallery
- Ideas
- Custom Visuals Ideas (read-only)
- Issues
- Issues
- Events
- Upcoming Events
Calling all Data Engineers! Fabric Data Engineer (Exam DP-700) live sessions are back! Starting October 16th. Sign up.
- Power BI forums
- Forums
- Get Help with Power BI
- Desktop
- creating a table with pivoting multiple columns.
- Subscribe to RSS Feed
- Mark Topic as New
- Mark Topic as Read
- Float this Topic for Current User
- Bookmark
- Subscribe
- Printer Friendly Page
- Mark as New
- Bookmark
- Subscribe
- Mute
- Subscribe to RSS Feed
- Permalink
- Report Inappropriate Content
creating a table with pivoting multiple columns.
Hi,
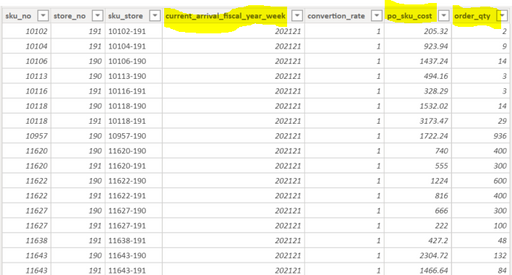
Currently, I have the below table and I'm trying to create a new table where I have:
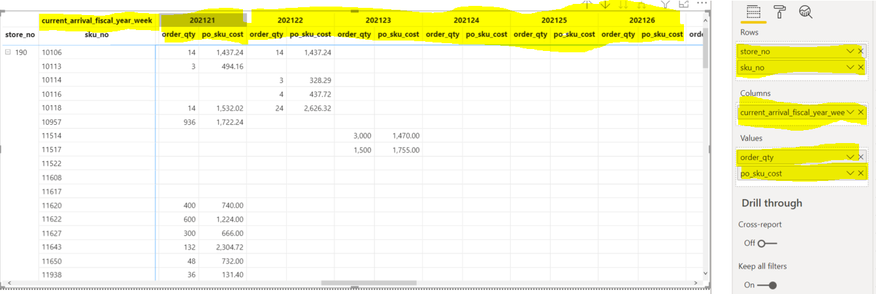
- current_arrival_fiscal_year_week in columns across the top
- SUM(order_qty) for each current_arrival_fiscal_year_week
- SUM(po_sku_cost) for each current_arrival_fiscal_year_week
- There would be a row for each sku and store_no.
- Instead of a row for each sku, store_no and current_arrival_fiscal_year_week.
The table would look like this, but be a table in the data model.
I've tried using the pivot column functionality in power query, but it only allows for pivoting one column instead of having both the po_sku_cost and order_qty for each week. Additionally, I've tried a few other ways as well.
After this, I'd be able to join to another table that is aggregated at the sku, store_no level.
Advice would be much appreicated, thanks so much.
- Mark as New
- Bookmark
- Subscribe
- Mute
- Subscribe to RSS Feed
- Permalink
- Report Inappropriate Content
@Anonymous not sure why would you like to pivot it. AS a best practice and data modeling practice, the unpivoted table is the way to go. What is the functionality you are not able to achieve the way your current data is?
Subscribe to the @PowerBIHowTo YT channel for an upcoming video on List and Record functions in Power Query!!
Learn Power BI and Fabric - subscribe to our YT channel - Click here: @PowerBIHowTo
If my solution proved useful, I'd be delighted to receive Kudos. When you put effort into asking a question, it's equally thoughtful to acknowledge and give Kudos to the individual who helped you solve the problem. It's a small gesture that shows appreciation and encouragement! ❤
Did I answer your question? Mark my post as a solution. Proud to be a Super User! Appreciate your Kudos 🙂
Feel free to email me with any of your BI needs.
- Mark as New
- Bookmark
- Subscribe
- Mute
- Subscribe to RSS Feed
- Permalink
- Report Inappropriate Content
The functionality I'm trying to achieve is creating a table that looks like the below.
- The PO data that I've spoken to in the OP on the right side of the below visual is aggregated at date, sku and location.
- The inventory data highlighted in yellow is aggregated at just the sku and location level.
- By pivoting the PO data, so I have the weeks in columns, I could then join the Inventory and pivoted PO data on the sku and location columns .
Helpful resources

FabCon Global Hackathon
Join the Fabric FabCon Global Hackathon—running virtually through Nov 3. Open to all skill levels. $10,000 in prizes!

Power BI Monthly Update - September 2025
Check out the September 2025 Power BI update to learn about new features.


